Australia, Mexico and Brazil Lead Major Global Wind Energy Markets on Asset Performance
IntelStor Global Onshore Wind Energy Asset Ranking indicates that performance-based maintenance has driven asset performance improvement in major global markets
HOUSTON, TEXAS, USA, March 16, 2020 /EINPresswire.com/ -- Amongst major global onshore wind energy markets with more than 5GW installed, Australia, Mexico and Brazil top the list for markets with turbines which routinely achieve a high level of availability and power output. This was the conclusion of recent market analysis undertaken by Energy Data Alliance partners IntelStor LLC and WindESCo Inc.A total of 54 countries were analyzed which have at least 100 MW of wind energy capacity installed. The operational wind turbines in these global markets have been ranked with a low, medium or high probability of underperformance. This probability was determined based upon factors including power output, asset availability, asset age, whether the specific turbine model is a current or legacy product offering, the type of service contract which is utilized on that project and the typical performance profile for the make and model.
While other global markets fared better than Australia, Mexico and Brazil on the percentage of their assets which achieve their performance targets, most tended to have significantly lower capacity installed. Additionally, many of these smaller markets have capacity which was installed recently (< 2 years ago), indicating the assets were still under a warranty period and more likely to achieve higher payback.
To underscore this analysis, we dig in to look at a few countries towards the top and bottom of the list.
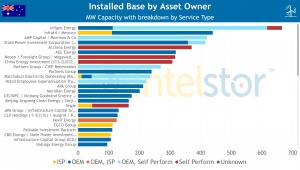
Australia currently has 6,738.55 MW of operational capacity as of the end of Q1 2020. The current amount of capacity which we believe to be out of warranty (i.e. at least +2 years minimum) is 6,172.94 MW. A ranking of the top asset owners in the market today is shown in the chart below including a breakdown of capacity by known service type.
Australia has a total capacity comprising 1,725.41 MW or 25.61%, which we believe to be a high probability which tends to routinely underperform on a P90 ranking.
Another 2,992.1 MW or 44.40% of capacity comprises turbines which are in a performance range where they are potentially more susceptible to underperformance, but have still fared well over the years due to diligent maintenance.
A total of 2,021.04 MW or 29.99% are high performers due to a combination of asset age as well as the specific make and model of turbine(s) being less susceptible to asset under-performance, unless it was due to a miscalibration issue.
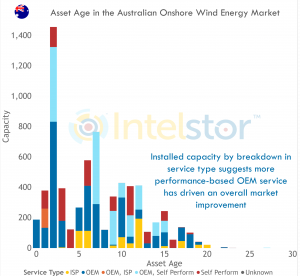
With a large proportion of assets under OEM care utilizing performance-based maintenance contracts, assets in the Australian market have seen an overall improvement over the years.
By contrast, Portugal currently has 5,436.8 MW of operational capacity as of the end of Q1 2020. The current amount of capacity which we believe to be out of warranty (i.e. at least +2 years minimum) is 5,377.7 MW. A ranking of the top asset owners in the market today is shown in the chart below including a breakdown of capacity by known service type.
Portugal has a total capacity comprising 1,562.8 MW or 28.74%, which we believe to be a high probability which tends to routinely underperform on a P90 ranking.
Another 3,759.6 MW or 69.15% of capacity comprises turbines which are in a performance range where they are potentially more susceptible to underperformance, but have still fared well over the years due to diligent maintenance.
A total of 114.4 MW or 2.10% are high performers due to a combination of asset age as well as the specific make and model of turbine(s) being less susceptible to asset under-performance, unless it was due to a miscalibration issue.
In this case, with assets ageing in the Portuguese market, and asset owners seeking to improve their financial returns, they have shifted to an in-house maintenance model to save cost, and focused on life extension techniques in order to drive improved asset performance.
With assets aging quickly in this market, the need for life extension techniques is likely to become more pronounced in the coming years unless a repowering campaign can be financially justified.
One example from the Portuguese market is Iberwind, which has a total installed base in Portugal of 671.95 MW across 43 wind parks with a total of 302 units that have an average asset age of 14.16 years.
Iberwind has a total capacity comprising 346.35 MW or 51.54%, which we believe to be a high probability which tends to routinely underperform on a P90 ranking.
Another 325.6 MW or 48.46% of capacity comprises turbines which are in a performance range where they are potentially more susceptible to underperformance, but have still fared well over the years due to diligent maintenance.
Iberwind has a total of 0 MW in capacity which we believe are high performers due to a combination of asset age as well as the specific make and model of turbine(s) being less susceptible to asset under-performance, unless it was due to a miscalibration issue.
The breakdown of Iberwind's installed capacity amongst Vestas, Nordex Acciona, Senvion and GE turbines suggests they would benefit from life extension technologies being applied.
The full analysis is available as part of the Global Wind Energy Asset Ranking Report, available for purchase at http://www.intelstor.com/store/Global-Wind-Energy-Asset-Ranking-Report-p126848811
Philip Totaro
IntelStor
+1 213-465-0080
email us here
Legal Disclaimer:
EIN Presswire provides this news content "as is" without warranty of any kind. We do not accept any responsibility or liability for the accuracy, content, images, videos, licenses, completeness, legality, or reliability of the information contained in this article. If you have any complaints or copyright issues related to this article, kindly contact the author above.


