Poor Return on Capital Threatens Survival of Some in Wind Turbine Supply Chain
Industry spent $33.4 billion on product development, but of more than 1,200 makes and models developed, only 11.6% of them achieved positive return on capital.
HOUSTON, TEXAS, UNITED STATES, February 11, 2019 /EINPresswire.com/ -- The Global Wind Energy Innovation Trends research report reveals that over the past 40 years of the wind industry’s development, wind turbine manufacturing companies have spent $33.4 billion on product development. That investment has led to the deployment of more than 390,000 wind turbines globally.But the industry also carries a dark secret. That staggering amount of investment has yielded a very poor return on capital (ROC) for most of the companies who have developed and sold wind turbines in the past 40 years. Of the 1,200 wind turbine models ever developed and offered for sale, only 11.6% of them have ever achieved a net positive ROC.
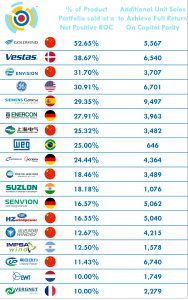
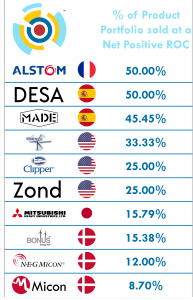
This fact helped spur a period of significant industry consolidation in that same time-frame. For an industry that once had over 200 global wind turbine manufacturers, we are now down to now only 37. For these remaining 37, only 18 of them have a track record for a positive return on capital for at least one of their products sold. All of them will require significant additional unit sales in order to achieve an overall net positive return on capital (i.e. above parity).
However, most wind turbine OEMs have a less that 50% net positive return on capital out of every product sold. This calculation is based upon the non-recurring engineering spent on product development, the CapEx expenditure on manufacturing tooling as well as other associated commercialization costs. We’ve also used typical gross margins and sale prices in global markets to calculate these figures.
Historically, the companies who had positive return on capital were successful for a time, and their ultimate undoing were the periods of market or policy uncertainty around the globe which caused them to drain their OpEx coffers.
While many still live on as the proud legacy of some modern turbine OEMs, the fact remains that many companies are still not as profitable as they need to be to survive in the future.
As a result, the industry is likely to see another round of consolidation in the supply chain before the year 2023 due to the increased pricing pressures which the turbine OEMs face. These pressures are partly the result of the loss of permanent subsidies in many markets around the world as well as the growing price competition from auctions / tenders in these international markets.
Additionally, increasing CapEx costs for new product development are introducing a competitive pressure and facilitating the M&A deals between OEMs. The net cost for bringing a 10kW turbine to market is significantly less than a 5.0MW turbine. Therefore, not every turbine manufacturing company is well capitalized and has the balance sheet strength to be able to compete by bringing new products to market as a result.
Nevertheless, the survivors of this forthcoming consolidation wave will have figured out a basic equation, but one which requires them to think globally about their product sales and position themselves more intelligently in the markets.
Your average 4 - 5MW onshore wind turbine designed from a “clean sheet of paper” would normally cost approximately US$120 – 150 million to bring to market depending on the drivetrain architecture, electrical system, etc. This includes the R&D cost for a new product development program, the costs associated with prototyping, testing and certification, as well as the costs for supply chain buildup in the sub-component sourcing.
That level of investment typically requires sales in the order of 340 – 450 units to achieve a ROC above parity, i.e. more net profit is made from unit sales than the cost of goods sold (COGS) plus the up-front non-recurring costs associated with designing and developing the product in the first place.
To achieve a solid return on capital, which exceeds parity to what was invested and results in the product development leading to a profitable product, companies must proactively pursue a strategy for product development and global sales which ensures net positive ROC is achievable.
For years companies lacked the tools and sophistication of analysis to understand these market dynamics. Now, with this new set of data analytics available to them, they can intelligently position themselves to achieve profitable returns on their capital investments.
The full Global Wind Energy Innovation Trends - 2019 research report is available at https://www.intelstor.com/store/Global-Wind-Energy-Innovation-Trends-2019-p86431271
Philip Totaro
IntelStor
+1 213-465-0080
email us here
Visit us on social media:
Facebook
Twitter
Google+
LinkedIn
Legal Disclaimer:
EIN Presswire provides this news content "as is" without warranty of any kind. We do not accept any responsibility or liability for the accuracy, content, images, videos, licenses, completeness, legality, or reliability of the information contained in this article. If you have any complaints or copyright issues related to this article, kindly contact the author above.


