
Demand or supply-driven? How firms view inflation right now
29 July 2026
By Niccolò Battistini and Giovanni Trebbi
Energy prices are surging again, pushing up inflation in the euro area. This ECB Blog post examines whether firms are attributing this to a demand surge or to supply constraints. Two approaches – textual analysis and empirical models – can help make the picture clearer.
For central banks, whether inflation stems from demand or supply makes a crucial difference. Demand-driven inflation (sometimes called demand-pull inflation) calls for a firm policy response. Meanwhile, supply-driven inflation (also known as cost-push inflation) warrants a more careful assessment. This second kind is often caused by developments that are largely outside a central bank’s control – something to be weathered rather than fought. Telling the two types of inflation apart in real time is one of the hardest challenges in monetary policy.
The war in the Middle East has brought this challenge back to the fore. Between February and June 2026, the surge in crude oil prices triggered by the conflict led to a sharp upswing in energy inflation, pushing euro area headline inflation up from 1.9% to 2.8% year on year (Chart 1, panel a). These developments are reminiscent of the events following Russia’s invasion of Ukraine in February 2022 (panel b). Now as then, the inflation surge appears to be largely driven by an energy supply shock. However, when designing the monetary policy response, the nature of the shock itself is only one part of the story. The balance between demand and supply pressures at the moment the shock hits also matters, as does the breadth, size and persistence of the shock. And here too, supply and demand factors both come into play.[1]
To answer this question, we draw on two complementary approaches. First, we look at what financial actors are saying about inflation, based on a textual analysis of corporate earnings calls and articles in the financial press. Second, we use two empirical models to examine what firms are telling business surveys about their expectations. Crucially, both approaches are based on timely, forward-looking indicators. That makes these tools particularly well suited to real-time assessment, especially in the absence of timely hard data.
Indeed, at the time of publication, we are not aware of any analyses based on hard data for the euro area that compare the nature of the recent inflation surge to that of the 2022 episode.[2]
Chart 1
Oil prices and HICP inflation in 2026 and 2022
(left-hand scale: USD/barrel; year-on-year change, percentage)
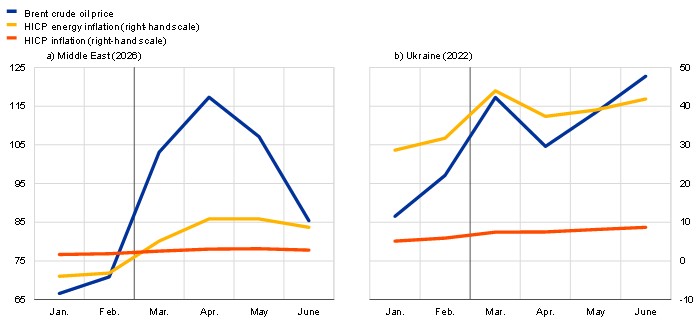
Sources: Energy Information Administration, Eurostat, European Commission and ECB staff calculations.
Notes: The vertical lines separate the periods before the outbreak of the war in the Middle East at the end of February 2026 (left) and in Ukraine at the end of February 2022 (right) from the periods that followed. The latest observations are for June 2026.
What companies and newspapers are saying
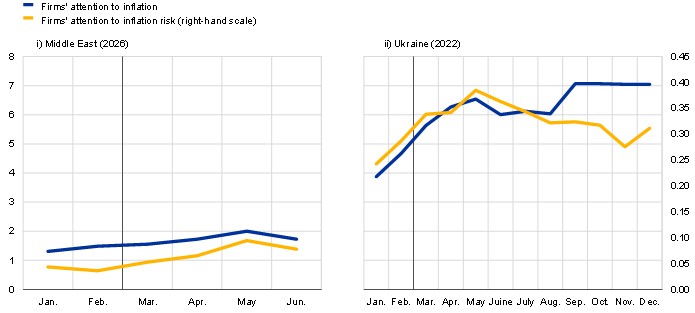
A first clue comes from earnings calls, the quarterly conference calls in which listed firms discuss their results and outlook with investors. By scanning these calls for mentions of both inflation and inflation risks, we can track how much attention firms are paying to price pressures and the risks they pose to their operations in near real time. In May 2026, firms’ focus on inflation and inflation risks had intensified since the start of the Middle East conflict. However, the levels and degrees of variation remained below those observed in March 2022, when Russia’s invasion of Ukraine sent energy prices spiralling (Chart 2, panel a).
A second indicator of what drives inflation comes from the financial press. Using a text analysis algorithm – specifically, a causality extraction method – we can identify and classify the causes of inflation reported in newspaper articles.[3] The algorithm first extracts the causes of inflation described from sentences that mention inflation together with explicit causal language. It then assigns these to either demand or supply narratives.[4] Demand narratives tend to cite factors such as strong consumer spending, fiscal deficits or monetary stimulus. Supply narratives tend to reference energy prices, supply chain disruptions or input costs.
The results are striking. Compared with 2022, since the start of the war in the Middle East demand-side narratives – stories about consumer spending and monetary stimulus – have played a smaller role than supply narratives – stories about energy costs and supply chain disruptions (Chart 2, panel b). More specifically, this time round the financial press has largely attributed inflation to energy cost-related supply narratives. In contrast, there was a broader mix of narratives back in 2022, with greater prominence given to supply chain disruptions. This is an important initial signal, pointing to comparatively clearer cost-push (rather than demand-pull) inflation in the current episode.
Chart 2
Firms’ attention to inflation and inflation risks and news-based narratives in 2026 and 2022
a) Firms’ attention to inflation and inflation risks
(cross-sectional average of sentences mentioning inflation keywords, three-month moving average)
b) Demand and supply narratives
(volume of Financial Times articles, period average)
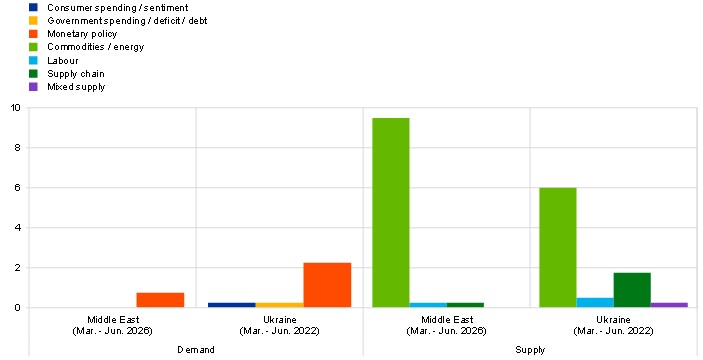
Sources: NL Analytics, Financial Times and ECB calculations.
Notes: In panel a), the vertical lines separate the periods before and after and the outbreak of the war in the Middle East at the end of February 2026 (i) and Russia’s invasion of Ukraine at the end of February 2022 (ii). Firms’ attention to inflation is the three-month moving average of the cross-sectional average number of NL Analytics earnings-call sentences mentioning inflation keywords. Firms’ attention to inflation risk is the three-month moving average of the cross-sectional average number of NL Analytics earnings-call sentences mentioning inflation keywords as well as risk or uncertainty-related language. The inflation keywords come from Song and Stern (2025). Risk and uncertainty-related language comes from Hassan et al. (2019). In panel b), the figures are derived from averages of the months considered. Demand and supply narratives are derived from Financial Times inflation articles using the causality extraction method in Trebbi (2025). The latest observations are for June 2026.
What business surveys reveal
For a precise assessment of the drivers of firms’ price expectations, we turn to the European Commission’s business surveys, which poll companies in the manufacturing, services and construction sector. Once a month, these surveys gather feedback about firms’ three-month-ahead expectations for prices and activity.[5] Once a quarter, firms are also asked about any specific obstacles limiting their production – e.g. insufficient demand, financial constraints, materials shortages or labour constraints.
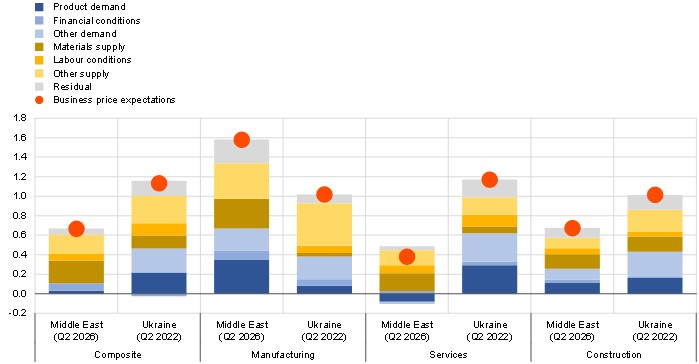
We then combine these responses into composite indices – weighted averages across sectors – and use two structural models to interpret their movements. A monthly model identifies two types of shock: demand shocks move activity and price expectations in the same direction, whereas supply shocks pull them in opposite directions. For instance, when inflation is driven by expansionary demand, firms expect both economic activity and prices to rise. Conversely, when adverse supply conditions push prices up, they expect economic activity to decline. A more granular quarterly model can then help us to further tease out factor-specific drivers: three shocks on the demand side (product demand, financial conditions and other demand) and three on the supply side (materials supply, labour conditions and other supply).[6]
So what do we find?
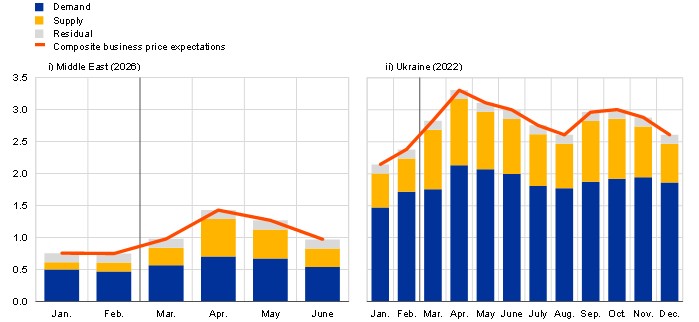
The composite index of business price expectations rose markedly after the outbreak of the war in the Middle East, and has remained above its pre-war level ever since. Structural decompositions can help explain why (Chart 3). Amid broadly stable demand-pull pressures, cost-push shocks drove up price expectations at the start of the war (panel a). At granular level, these shocks mainly reflected materials supply shortages – linked to higher energy prices – and were concentrated in manufacturing – particularly in energy-intensive subsectors such as chemicals, refined petroleum and paper products (panel b).
As these findings reveal, today’s picture is quite different from the one in 2022. After Russia’s invasion of Ukraine, business price expectations stood significantly above their current level – by about two standard deviations. The higher level in 2022 reflected stronger broad-based inflationary pressures, as demand was buoyant – driven by the post-pandemic reopening, especially in services – while supply was constrained – with global bottlenecks still biting, most notably in manufacturing. Also, the composition of demand and supply shocks was different back in 2022. Demand-pull pressures dominated in 2022, whereas cost-push inflationary forces have played a comparatively larger role in the current episode.
Chart 3
Drivers of business price expectations in 2026 and 2022
a) Demand-supply decomposition of monthly composite business price expectations
(standardised balances)
b) Granular decomposition of quarterly business price expectations in the two episodes
(one-quarter changes in standardised balances)
Sources: European Commission and ECB staff calculations.
Notes: In panel a), the vertical lines separate the periods before and after Russia’s invasion of Ukraine at the end of February 2022 (i) and the outbreak of the war in the Middle East at the end of February 2026 (ii). The decomposition is estimated using a Bayesian structural vector autoregression model on monthly data for composite business expectations for activity and prices. In panel b), the decomposition is estimated using a Bayesian structural vector autoregression model on quarterly data for composite business expectations for activity and prices, as well as factors limiting production (insufficient demand, financial constraints, shortage of materials and equipment, shortage of labour force, other limits). In both panels, “residual” refers to the sum of a constant and an unexplained shock. Composite business price expectations refer to the gross value added-weighted average of three-month-ahead selling price expectations for manufacturing (22%), services (71%) and construction (7%). For further details on the estimation, see Battistini and Neves (2026). The latest observations are for June 2026 in panel a) and for the second quarter of 2026 in panel b).
What all this means for monetary policy
Taken together, the two approaches tell a consistent story. Unlike the 2022 episode, the current rise in inflation has been driven, first and foremost, by a supply shock. It has been fuelled by rising energy prices passing through the production chain, rather than by a broad-based surge in demand. Firms understand this. They have paid increasing attention to inflation and inflation risks, and their demand expectations have remained flat. The press understands this too. Supply narratives about energy prices have dominated media coverage.
For the ECB, these findings matter. A supply-driven inflation episode does not automatically call for the same forceful tightening that demand-pull inflation would warrant. However, supply shocks can become entrenched if they feed more broadly into wages or inflation expectations and add to demand pressures. Monitoring the drivers of inflation based on firms’ expectations – ahead of any official hard data – can be useful for calibrating policy appropriately in real time.
The two frameworks presented here offer just such a forward-looking perspective. Combined, they provide an early-warning system – grounded in what newspapers report, as well as in what firms say and expect – that can help central banks stay ahead of rapidly shifting economic conditions.
The views expressed in each blog entry are those of the author(s) and do not necessarily represent the views of the European Central Bank and the Eurosystem.
Check out The ECB Blog and subscribe for future posts.
For topics relating to banking supervision, why not have a look at The Supervision Blog?
Legal Disclaimer:
EIN Presswire provides this news content "as is" without warranty of any kind. We do not accept any responsibility or liability for the accuracy, content, images, videos, licenses, completeness, legality, or reliability of the information contained in this article. If you have any complaints or copyright issues related to this article, kindly contact the author above.
