
Fact Sheet: In Vitro Fertilization (IVF) Use Across the United States
KEY POINTS
- Infertility affects millions of Americans in the United States at some point in their life.
- Difficulty conceiving can be caused by a variety of factors such as age, health conditions, and for couples who are same sex or individuals without a partner and cannot otherwise conceive. In addition, some couples experience unexplained infertility where tests reveal no obvious causes of infertility.
- Fertility treatments, including assisted reproductive technology (ART) procedures such as in vitro fertilization (IVF), allow those who experience infertility a potential path to expand their families.
- IVF represents greater than 99% of ART procedures performed and is an important fertility treatment option because it can help individuals to conceive who may not be able to using other fertility treatment methods.
- In 2021, 86,146 infants born (or 2.3% of all infants born in the U.S.) were conceived through the use of ART.
- IVF enables individuals who use fertility preservation services to save their eggs, sperm, or reproductive tissues to have children at a later time.
- In 2018, over 69% of the 120,000 individuals of reproductive age diagnosed with cancer required fertility preservation procedures and services, now considered a standard of care.
- Use of ART occurs across the country. The top ten states with the most births using ART in 2021 were California, New York, Texas, New Jersey, Illinois, Massachusetts, Florida, Pennsylvania, Virginia and Georgia.
Many Individuals Experience Infertility and Rely on In Vitro Fertilization to Become Pregnant
Infertility is a common challenge affecting millions of Americans in the United States and can have important implications for individuals’ well-being. According to the most recent National Survey of Family Growth, approximately 9% of married women* aged 15 to 49 years old are estimated to experience some form of infertility.1 An earlier version of the survey estimated that approximately 9% of men aged 15 to 44 years old experience some form of infertility.2 As a result of experiencing challenges to conceive, an estimated 1 in 8 women between the ages of 15 and 49 years old have received infertility services in their lifetime.3 In addition to infertility challenges, same sex couples and those who are single but desire to have a child may also pursue fertility assistance. In 2021, approximately 86,146 infants were born using assisted reproductive technology (ART).4 ART refers to all fertility treatments which involve handling either eggs or embryos. More specifically, the ART process includes the surgical retrieval of a woman’s eggs from her ovaries (and freezing them for future use, if applicable), followed by combining the eggs with sperm in a laboratory to create an embryo, and then either returning the embryo to the woman’s body, freezing it for later use, or donating to another gestational carrier.† The most common form of ART is in vitro fertilization (IVF), in which embryos are first created from the combined eggs and sperm and then either transferred into the woman’s uterus or frozen for potential later use, which are later transferred to a woman’s uterus. IVF accounts for over 99% of ART procedures performed in the U.S.5
Causes of and Risk Factors for Infertility
Both men and women can have conditions that contribute to infertility. Causes and risk factors of infertility vary between women and men, though in some cases remain unknown (Table 1 in Appendix). Infertility in men is most often evaluated by a semen analysis to identify any potential abnormalities of the sperm such as low sperm count, low sperm mobility, or sperm quality issues. Male fertility factors were a primary reason for pursuing ART in nearly 30% of cases in 2021. Infertility among women can be more complex as conditions impacting multiple reproductive organs (ovaries, fallopian tubes, uterus) can lead to infertility. The most common causes of infertility among women seeking ART are diminished ovarian reserves (27%), ovulation issues (14%), and tubal factors (10%).6 In addition, health conditions, genetic factors, and contributing risk factors affecting both men and women, such as older age, unhealthy weight, and substance use can increase the risk of infertility (Figure 1).7
Figure 1. Contributing risk factors for infertility among women and men in the United States
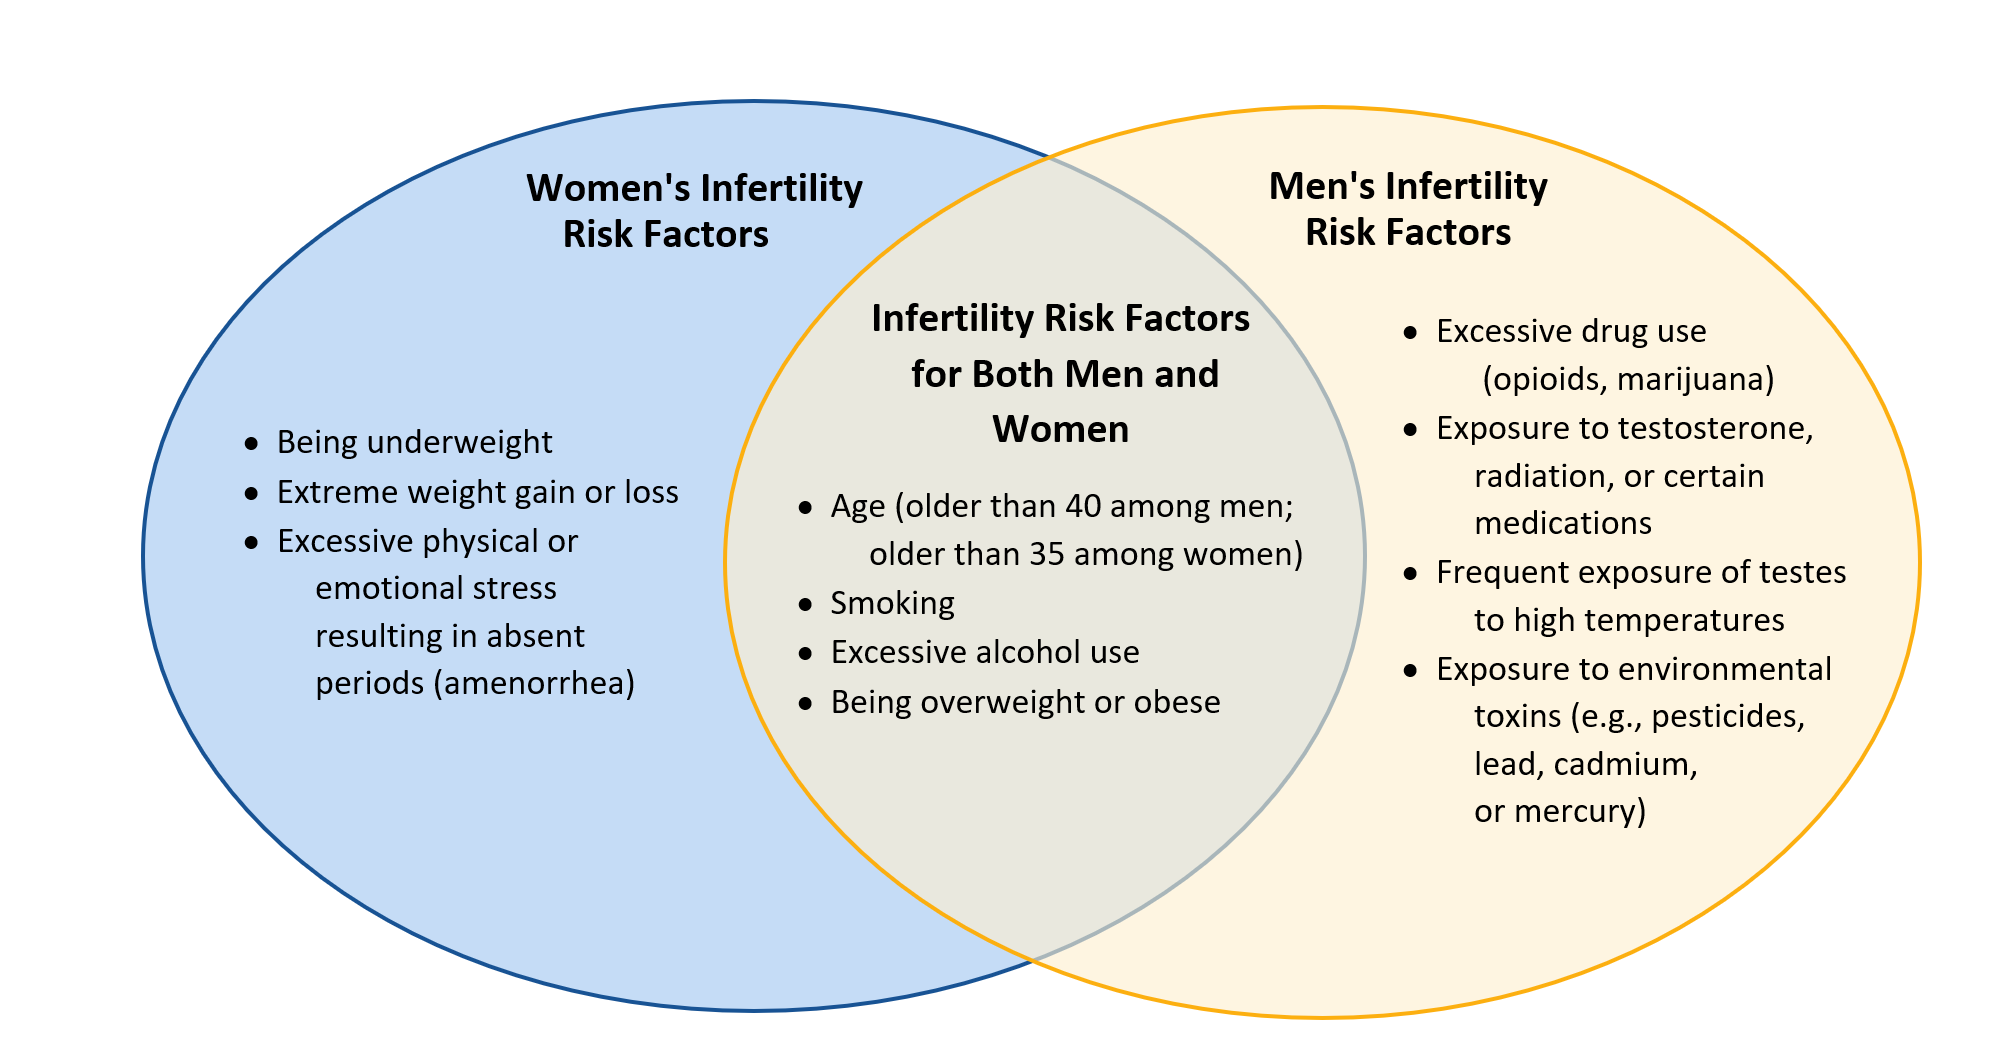
Source: Centers for Disease Control and Prevention, National Center for Chronic Disease Prevention and Health Promotion, Division of Reproductive Health. Infertility. Accessed at https://www.cdc.gov/reproductivehealth/infertility/ on Feb 28, 2024.
Why Do Many Americans Rely on In Vitro Fertilization as a Safe and Effective Method to Become Pregnant?
Infertility Treatment Pathways
There are a variety of treatment options for infertility, including medication, surgery, intrauterine insemination (IUI), or ART,‡ such as IVF. The method of treatment often depends on the specific factors contributing to, and the duration of, infertility, age of the female, and the individual or couple’s preference after receiving counseling on each treatment option’s success rates, risks, and benefits. The first step in determining which treatment might be most appropriate is to identify the clinical cause(s) of infertility through diagnostic procedures such as laboratory testing, semen analysis, and/or reproductive organ imaging studies and procedures. When a likely cause of infertility has been identified, treatment options are able to be specifically targeted. Some conditions, such as abnormal thyroid hormone levels, can be corrected with medication, while other conditions such as fibroids in the uterine cavity may require a surgical intervention.8 However, if medication and other non-invasive procedures or surgery (if applicable) are unable to achieve a successful pregnancy, more sophisticated fertility assistance procedures such as IUI, ART, and surrogacy may be pursued. In some cases, a combination of these treatments is required.
In the case of ART, reasons for ART use remain varied (Table 2 in Appendix) and multiple § are often needed to successfully conceive. As a result, these procedures can be costly. For instance, costs for a single cycle of IVF have recently been estimated to range from $15,000 to $20,000 and can exceed $30,000.9 Given the average number of cycles that are needed to become pregnant from IVF is 2.5, this means that the average cost of IVF to conceive successfully can easily exceed $40,000.10 ,11 ,12 A survey of fertility clinics in California reported average out-of-pocket costs of $24,000 per IVF cycle ($61,000 per successful outcome) and $38,000 per IVF cycle with a donor egg ($73,000 per successful outcome).13
IVF treatment is often not covered by insurance, so the cost of treatment can pose a significant access challenge for lower income individuals. The majority of states (29 states) do not require private insurance to cover any fertility services. Select services are required in 21 states and 15 states include IVF coverage mandates.14 Further, these state mandates do not apply to self-insured plans, which include 61% of workers.15 Medicaid coverage of fertility diagnosis or treatment is optional for states and coverage varies from state to state. Some states, like New York and Utah, choose to cover diagnosis and treatment of fertility services through Medicaid, while other states only cover diagnosis.16
Why Many People Rely on In Vitro Fertilization and the Importance of Fertility Preservation Services
Individuals may choose to use IVF for a variety of reasons, including that they are not yet ready to have a child but want to preserve their fertility options for the future. For instance, this could be done prior to receiving certain treatments for cancer, sickle cell anemia, or lupus, which can cause infertility. In the case where an individual is diagnosed with cancer during their reproductive years, cancer treatments including chemotherapy, radiation, and surgery can damage eggs and sperm, reproductive organs, impact endocrine functioning and result in birth defects in the person’s future children.17 In 2018, more than 120,000 patients diagnosed with cancer were of reproductive age (between 15 and 44 years old) and it is estimated that over 69% of these patients were in need of fertility preservation procedures and services, which is now considered a standard of care.18 ,19
A large proportion of all ART cycles involve freezing egg or embryos. In 2021, nearly 41% of ART cycles (167,689 cycles) were egg or embryo banking cycles in which all resulting eggs or embryos were frozen for future use.20 Across all age groups, around 80% of treatment cycles involving ART procedures used frozen embryos, rather than having an immediate transfer (Table 3 in Appendix).
Health Outcomes Related to Assisted Reproductive Technology Procedures
ART procedures have been available in the US since 1981 and research suggests** that ART is a relatively safe procedure. Overall, adverse outcomes are rare and much of the risk associated with ART outcomes is explained by the higher proportion of multiple births†† in the ART population, which have become less common.21
Approximately 12.5% of infants conceived through ART are multiples compared to 3.2% of all infants in the overall birth population. The higher proportion of multiple births in the ART infant population accounts for a high proportion of low birthweight infants (14.7% compared to 8.5%) and preterm births (19.7% compared to 10.5%). Compared to risks for multiple births, the risks to both mother and child are lower for singleton births.‡‡ ,22 ,23
Risks for the mother during an ART pregnancy include higher levels of hypertension, placental complications, hemorrhage, preterm delivery, the need for a Cesarean section, and in rare cases ovarian hyperstimulation syndrome (OHSS).24 ,25 Most cases are mild, but severe OHSS, which is rare (accounting for about 2% of OHSS cases26 ), can cause serious complications including blood clots, kidney failure, severe electrolyte imbalance, and severe fluid buildup in the chest or abdomen.27
The majority of children conceived through the use of ART are born without birth defects and any increased risk due to IVF is minimal.28 ,29
Among the health conditions that have been examined in children born through IVF, are intellectual disability, cerebral palsy, autism, and childhood cancer. Evidence suggests that there is little to no difference in the risk of an intellectual disability or childhood cancer in infants born using IVF.30 ,31 ,32 A recent meta-analysis found that singleton children born through IVF had a slight increased risk of developing cerebral palsy and similar risk of developing autism after accounting for sociodemographic factors.33 ,34
Utilization of Infertility Treatments
Between 2012 and 2021, ART use has more than doubled and the number of infants born who were conceived through ART has increased by 50%. In 2021, an estimated 2.3% of all infants born in the United States were conceived using ART. Approximately 413,776 ART cycles were performed at 453 reporting clinics resulting in 112,088 pregnancies in the United States.35 Of these pregnancies, 86,146 ART-conceived infants were born in 2021.36
The proportion of live births using ART increases with the mother’s age (Figure 2). Of women aged 40-45 with live births in 2023, 9% involved the use of ART, whereas for women aged 45 years and older, ART was utilized in nearly one-third of live births. ART use also varies geographically across the U.S. States with the highest number of infants born with the use of ART each year include California with over 11,000 infants, New York (almost 9,000 infants), Texas (over 7,000 infants), and New Jersey and Illinois with around 5,000 infants (Figure 3 and Table 4). Among women using ART, the majority did not have other living children (55%).
Figure 2. Percentage of all live births conceived through the use of ART by mother’s age, 2023
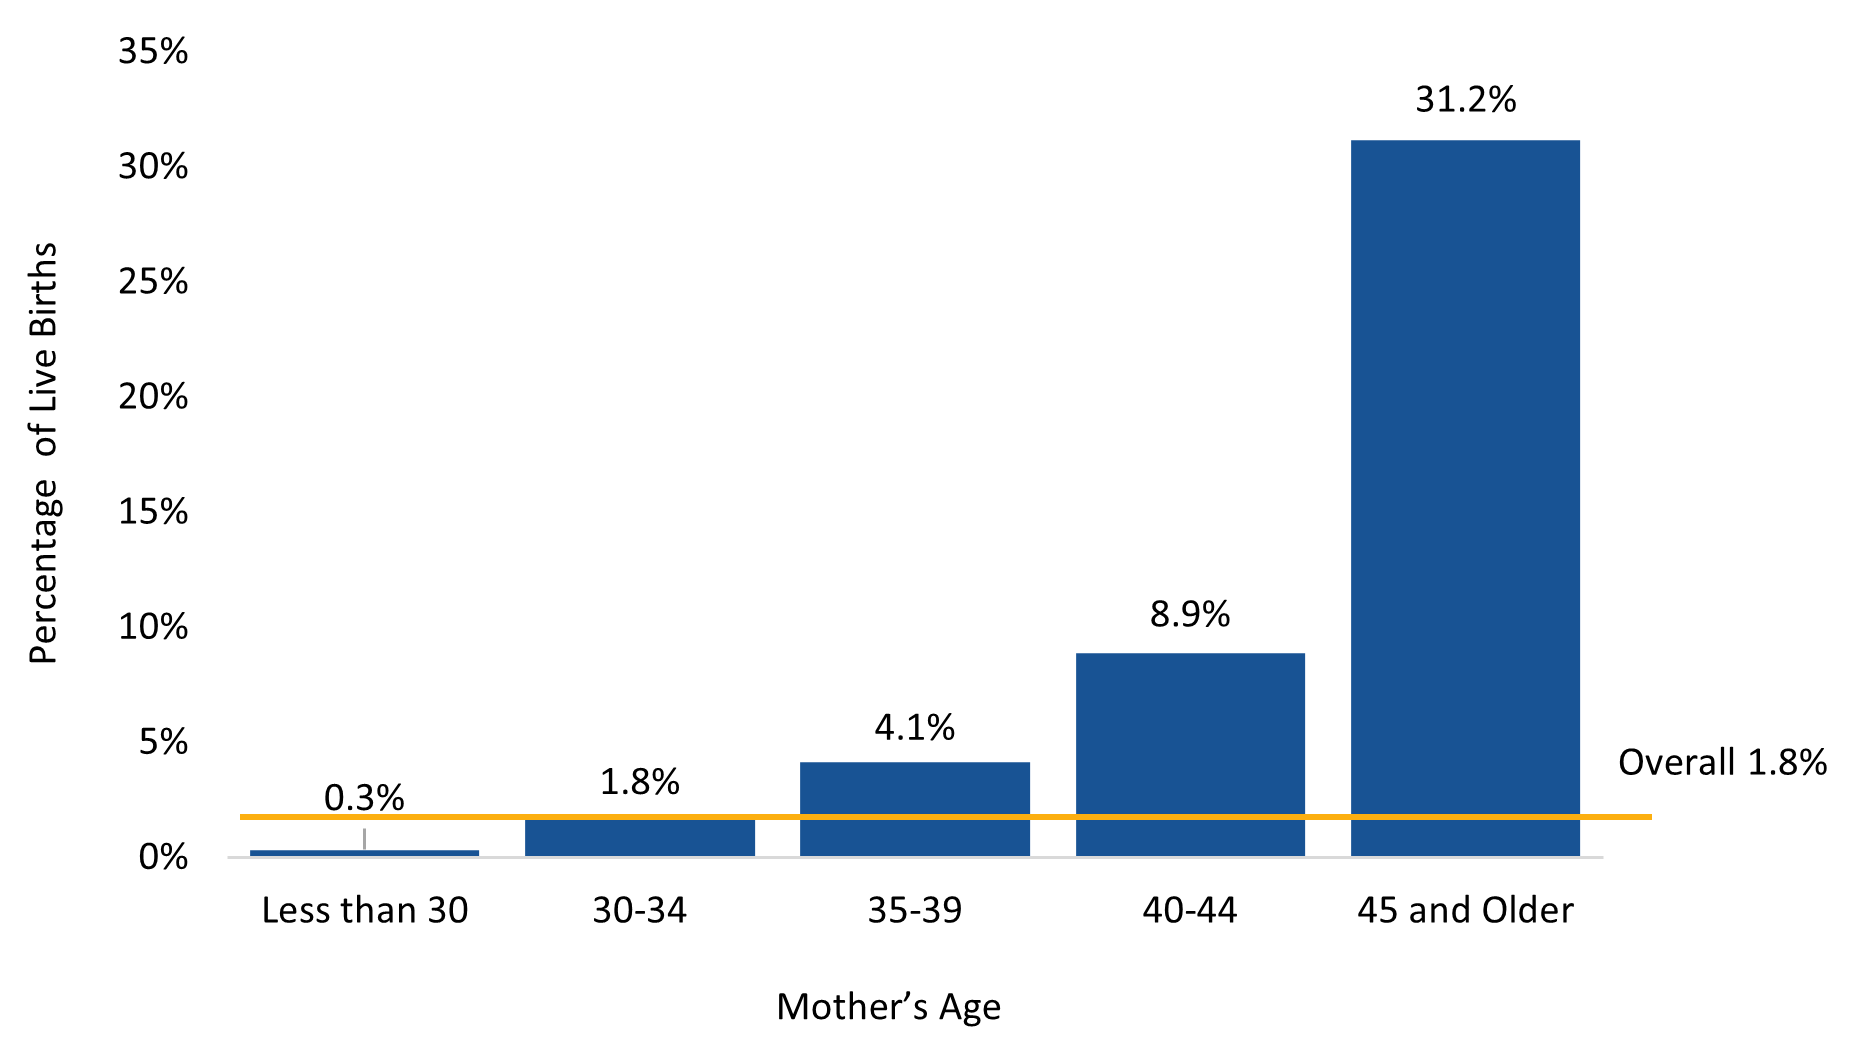
Source: Centers for Disease Control and Prevention, National Center for Health Statistics. National Vital Statistics System, Provisional Natality on CDC WONDER Online
Database. Data are from the Natality Records 2023 through Last Month, as compiled from data provided by the 57 vital statistics jurisdictions through the Vital Statistics Cooperative Program. Accessed at http://wonder.cdc.gov/natality-expanded-provisional.html on Feb 28, 2024.
Note: ART use has been found to be underreported in natality records.
Figure 3. Map of infants conceived through the use of ART by State, 2021
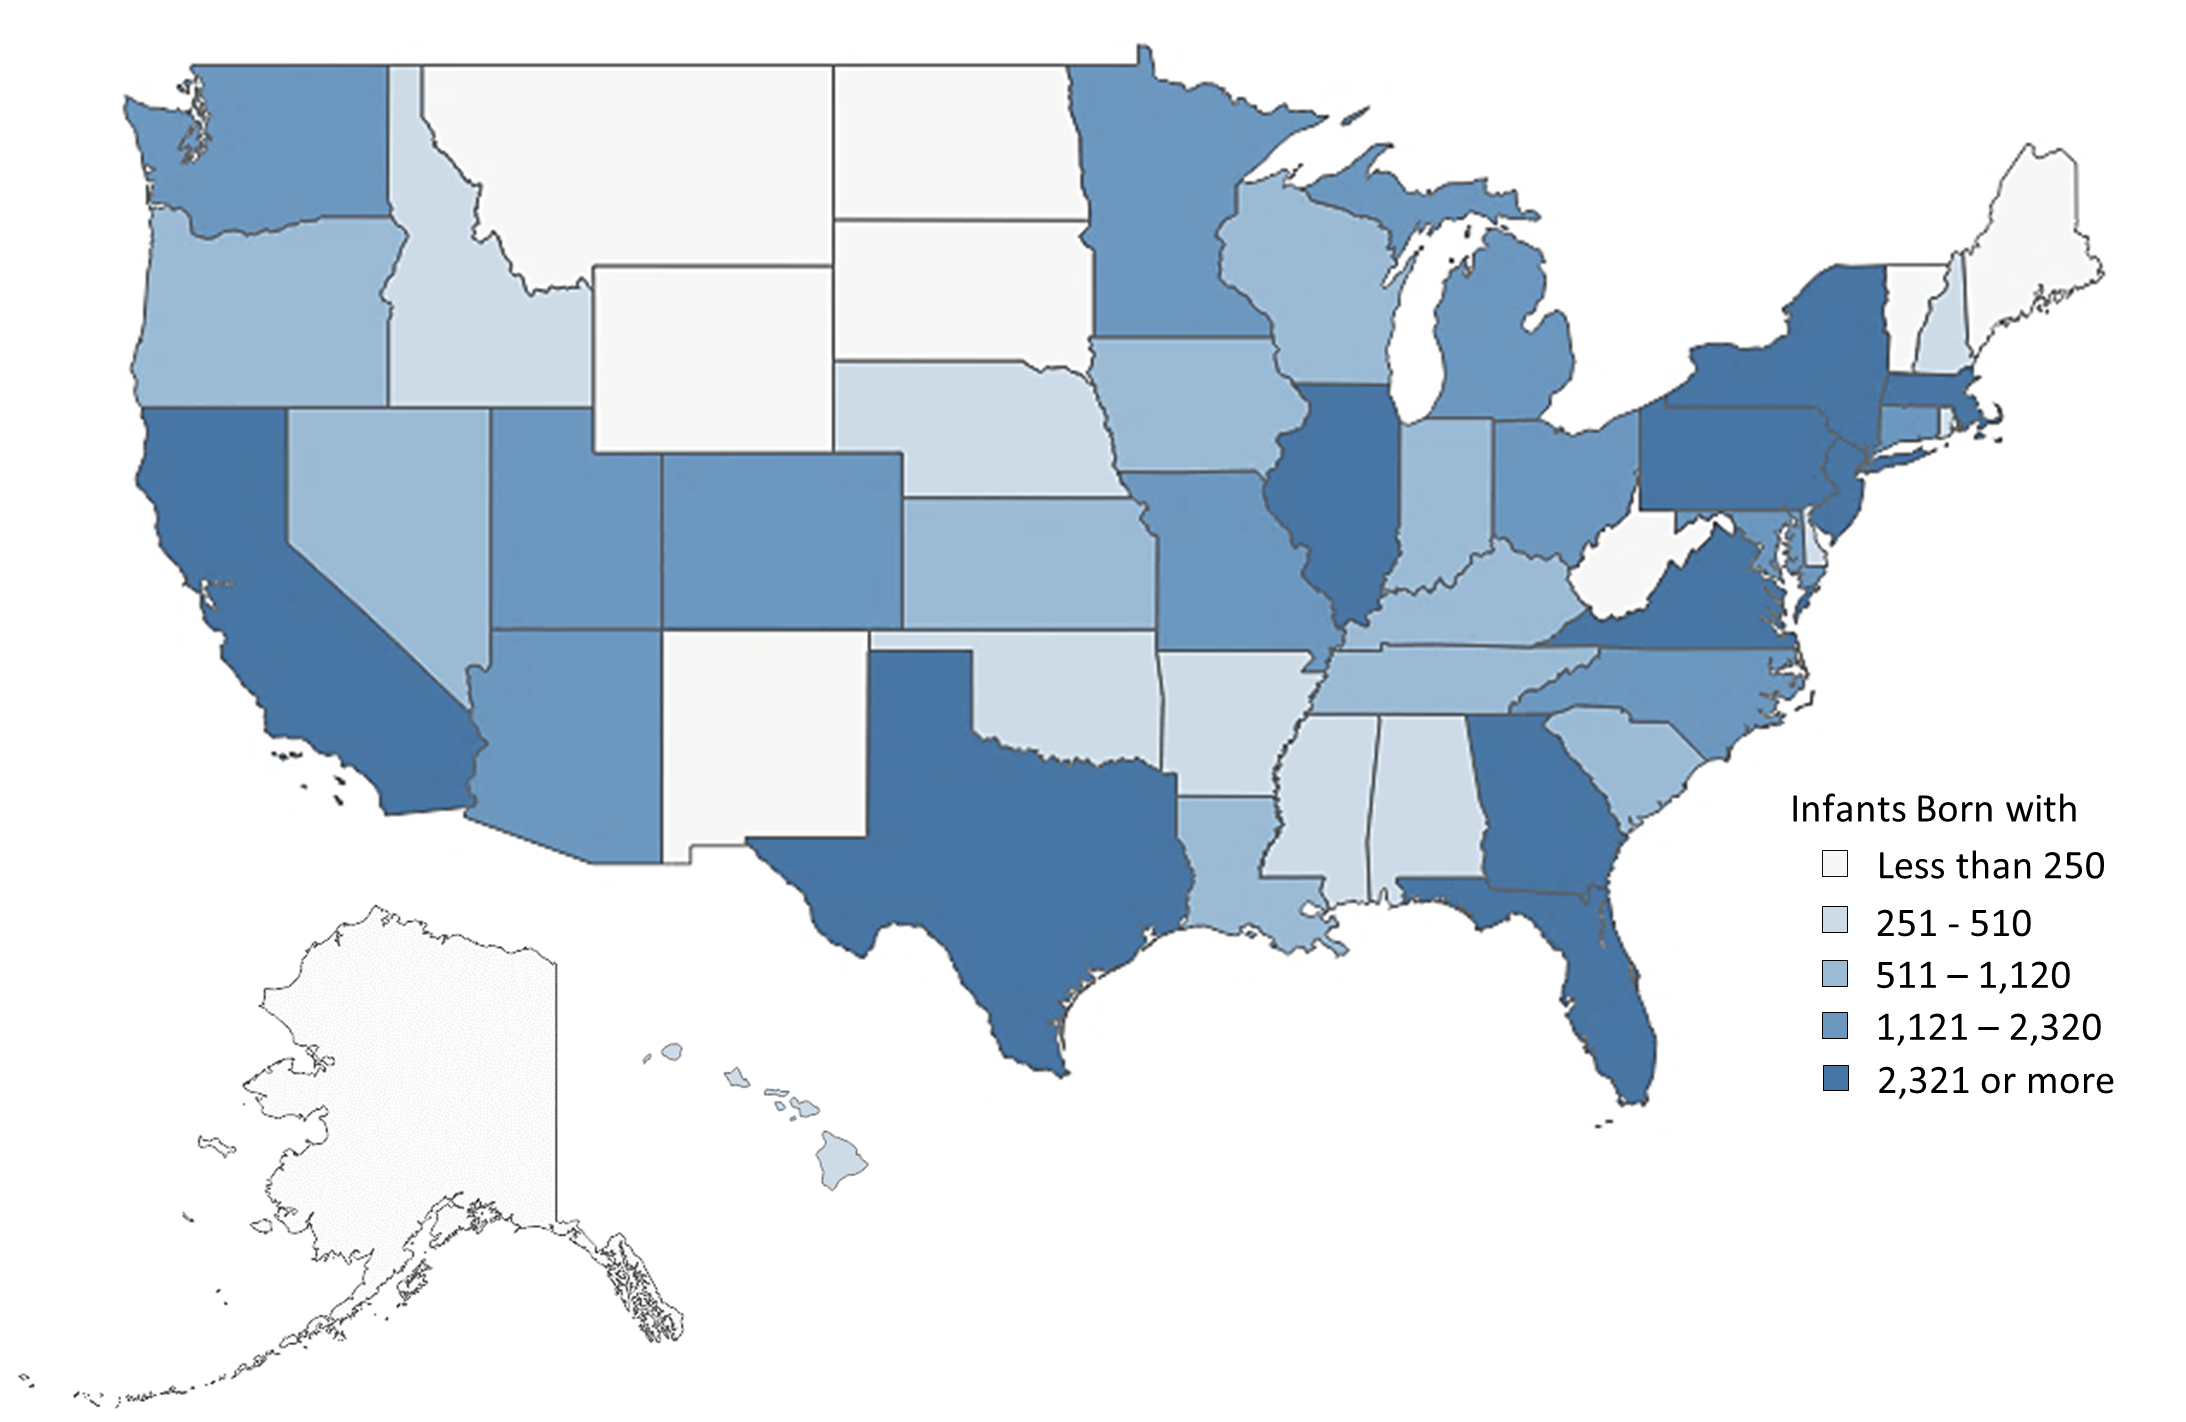
Source: Sunderam S, Zhang Y, Jewett A, Mardovich S, Kissin DM. State-Specific Assisted Reproductive Technology Surveillance, United States: 2021 Data Brief. Centers for Disease Control and Prevention, US Dept of Health and Human Services; 2023.
APPENDIX
Table 1. Causes of infertility among women and men in the United States
| Causes of Infertility among Women | Causes of Infertility among Men |
|---|---|
|
|
Source: Centers for Disease Control and Prevention, National Center for Chronic Disease Prevention and Health Promotion, Division of Reproductive Health. Infertility. Accessed at https://www.cdc.gov/reproductivehealth/infertility/ on Feb 28, 2024.
Table 2. Reasons for seeking ART in the United States, in 2021*
| Reasons for seeking ART | |
|---|---|
| Egg or embryo banking | 40.9% |
| Other factor | 30.0% |
| Male factor | 27.8% |
| Diminished ovarian reserve | 26.9% |
| Preimplantation genetic testing | 16.6% |
| Ovulatory dysfunction | 14.3% |
| Unexplained factor | 10.5% |
| Tubal factor | 10.4% |
| Endometriosis | 6.5% |
| Recurrent pregnancy loss | 6.3% |
| Uterine factor | 5.8% |
| Gestational carrier | 1.4% |
*National data based on 413,776 ART cycles in 2021.
Note: Percentages add to over 100% because more than one reason can be reported for each ART cycle.
Source: Centers for Disease Control and Prevention. 2021 Assisted Reproductive Technology Fertility Clinic and National Summary Report. US Dept of Health and Human Services; 2023. Accessed from Report-ART-Fertility-Clinic-National-Summary-H.pdf (cdc.gov)
Table 3. ART use in the United States, in 2021
| Age of patient (years) |
Percentage of those who used ART in 2021*
|
Percentage of ART cycles in which patients used their own eggs/embryos* | Percentage of ART cycles in which patients used donor eggs/embryos* | Percentage of transfers used frozen embryosa | |
|---|---|---|---|---|---|
| Less than35 | 36.2% | 58.9% | 2.3% | 84.0% | |
| 35-37 | 23.4% | 56.0% | 3.0% | 86.1% | |
| 38-40 | 20.7% | 51.9% | 5.1% | 84.6% | |
| Over40 | 19.7% | 39.1% | 21.8% | 79.8% | |
* National data based on 413,776 ART cycles.
a National data based on 202,054 ART cycles in which at least one embryo was transferred.
ART: Assisted Reproductive Technology
Source: Centers for Disease Control and Prevention, National Center for Chronic Disease Prevention and Health Promotion, Division of Reproductive Health. Assisted Reproductive Technology (ART) Data, Patient and Cycle Characteristics. Accessed at Assisted Reproductive Technology (ART) Data: Clinic | DRH | CDC on Feb 28, 2024.
Table 4. Number of infants conceived through the use of ART in 2021 by State
| Patient’s reporting area of residencea | Total number of infants bornb | Number of ART infants bornc | Proportion of ART infants among all infants, % |
|---|---|---|---|
| Alabama | 58,054 | 340 | 0.6 |
| Alaska | 9,367 | 92 | 1.0 |
| Arizona | 77,916 | 1,319 | 1.7 |
| Arkansas | 35,965 | 258 | 0.7 |
| California | 420,608 | 11,392 | 2.7 |
| Colorado | 62,949 | 1,781 | 2.8 |
| Connecticut | 35,670 | 1,584 | 4.4 |
| Delaware | 10,482 | 274 | 2.6 |
| District of Columbia | 8,660 | 504 | 5.8 |
| Florida | 216,260 | 3,692 | 1.7 |
| Georgia | 124,073 | 2,321 | 1.9 |
| Hawaii | 15,620 | 375 | 2.4 |
| Idaho | 22,427 | 384 | 1.7 |
| Illinois | 132,189 | 4,791 | 3.6 |
| Indiana | 79,946 | 1,115 | 1.4 |
| Iowa | 36,835 | 823 | 2.2 |
| Kansas | 34,705 | 518 | 1.5 |
| Kentucky | 52,214 | 629 | 1.2 |
| Louisiana | 57,437 | 712 | 1.2 |
| Maine | 12006 | 242 | 2.0 |
| Maryland | 68,285 | 2,311 | 3.4 |
| Massachusetts | 69,137 | 3,717 | 5.4 |
| Michigan | 104,980 | 2,015 | 1.9 |
| Minnesota | 64,425 | 1,670 | 2.6 |
| Mississippi | 35,156 | 274 | 0.8 |
| Missouri | 69,453 | 1,132 | 1.6 |
| Montana | 11,231 | 166 | 1.5 |
| Nebraska | 24,609 | 409 | 1.7 |
| Nevada | 33,686 | 689 | 2.0 |
| New Hampshire | 12,625 | 447 | 3.5 |
| New Jersey | 101,497 | 5,106 | 5.0 |
| New Mexico | 21,391 | 195 | 0.9 |
| New York | 210,742 | 8,707 | 4.1 |
| North Carolina | 120,466 | 2,294 | 1.9 |
| North Dakota | 10,112 | 138 | 1.4 |
| Ohio | 129,791 | 2,226 | 1.7 |
| Oklahoma | 48,410 | 471 | 1.0 |
| Oregon | 40,914 | 908 | 2.2 |
| Pennsylvania | 132,622 | 3,167 | 2.4 |
| Puerto Rico | 19,304 | 84 | 0.4 |
| Rhode Island | 10,464 | 256 | 2.4 |
| South Carolina | 57,185 | 949 | 1.7 |
| South Dakota | 11,369 | 115 | 1.0 |
| Tennessee | 81,717 | 1,025 | 1.3 |
| Texas | 373,594 | 7,315 | 2.0 |
| Utah | 46,712 | 1173 | 2.5 |
| Vermont | 5,384 | 159 | 3.0 |
| Virginia | 95,825 | 2,383 | 2.5 |
| Washington | 83,911 | 2,181 | 2.6 |
| West Virginia | 17,198 | 175 | 1.0 |
| Wisconsin | 61,781 | 1,050 | 1.7 |
| Wyoming | 6,237 | 93 | 1.5 |
| Total | 3,683,596 | 86,146 | 2.3 |
a State of residence as reported by patient. In cases of missing patient’s residence data (1.8%), state was assigned as the location where the ART procedure was performed.
b US births exclude births to non-US residents. Source: CDC, Natality public use file and CD-ROM. Hyattsville, MD, National Center for Health Statistics.
c Includes infants conceived from ART procedures performed in 2020 and born in 2021 and infants conceived from ART procedures performed in 2021 and born in 2021. ART births exclude births to non-US residents.
ART: Assisted Reproductive Technology
Source: Sunderam S, Zhang Y, Jewett A, Mardovich S, Kissin DM. State-Specific Assisted Reproductive Technology
Surveillance, United States: 2021 Data Brief. Centers for Disease Control and Prevention, US Dept of Health
And Human Services; 2023. Accessed from: State-Specific-ART-Surveillance-2021-Data-Brief-H.pdf (cdc.gov)
Figure 4. Percentage of all live births conceived through the use of ART by mother’s race and education, 2023
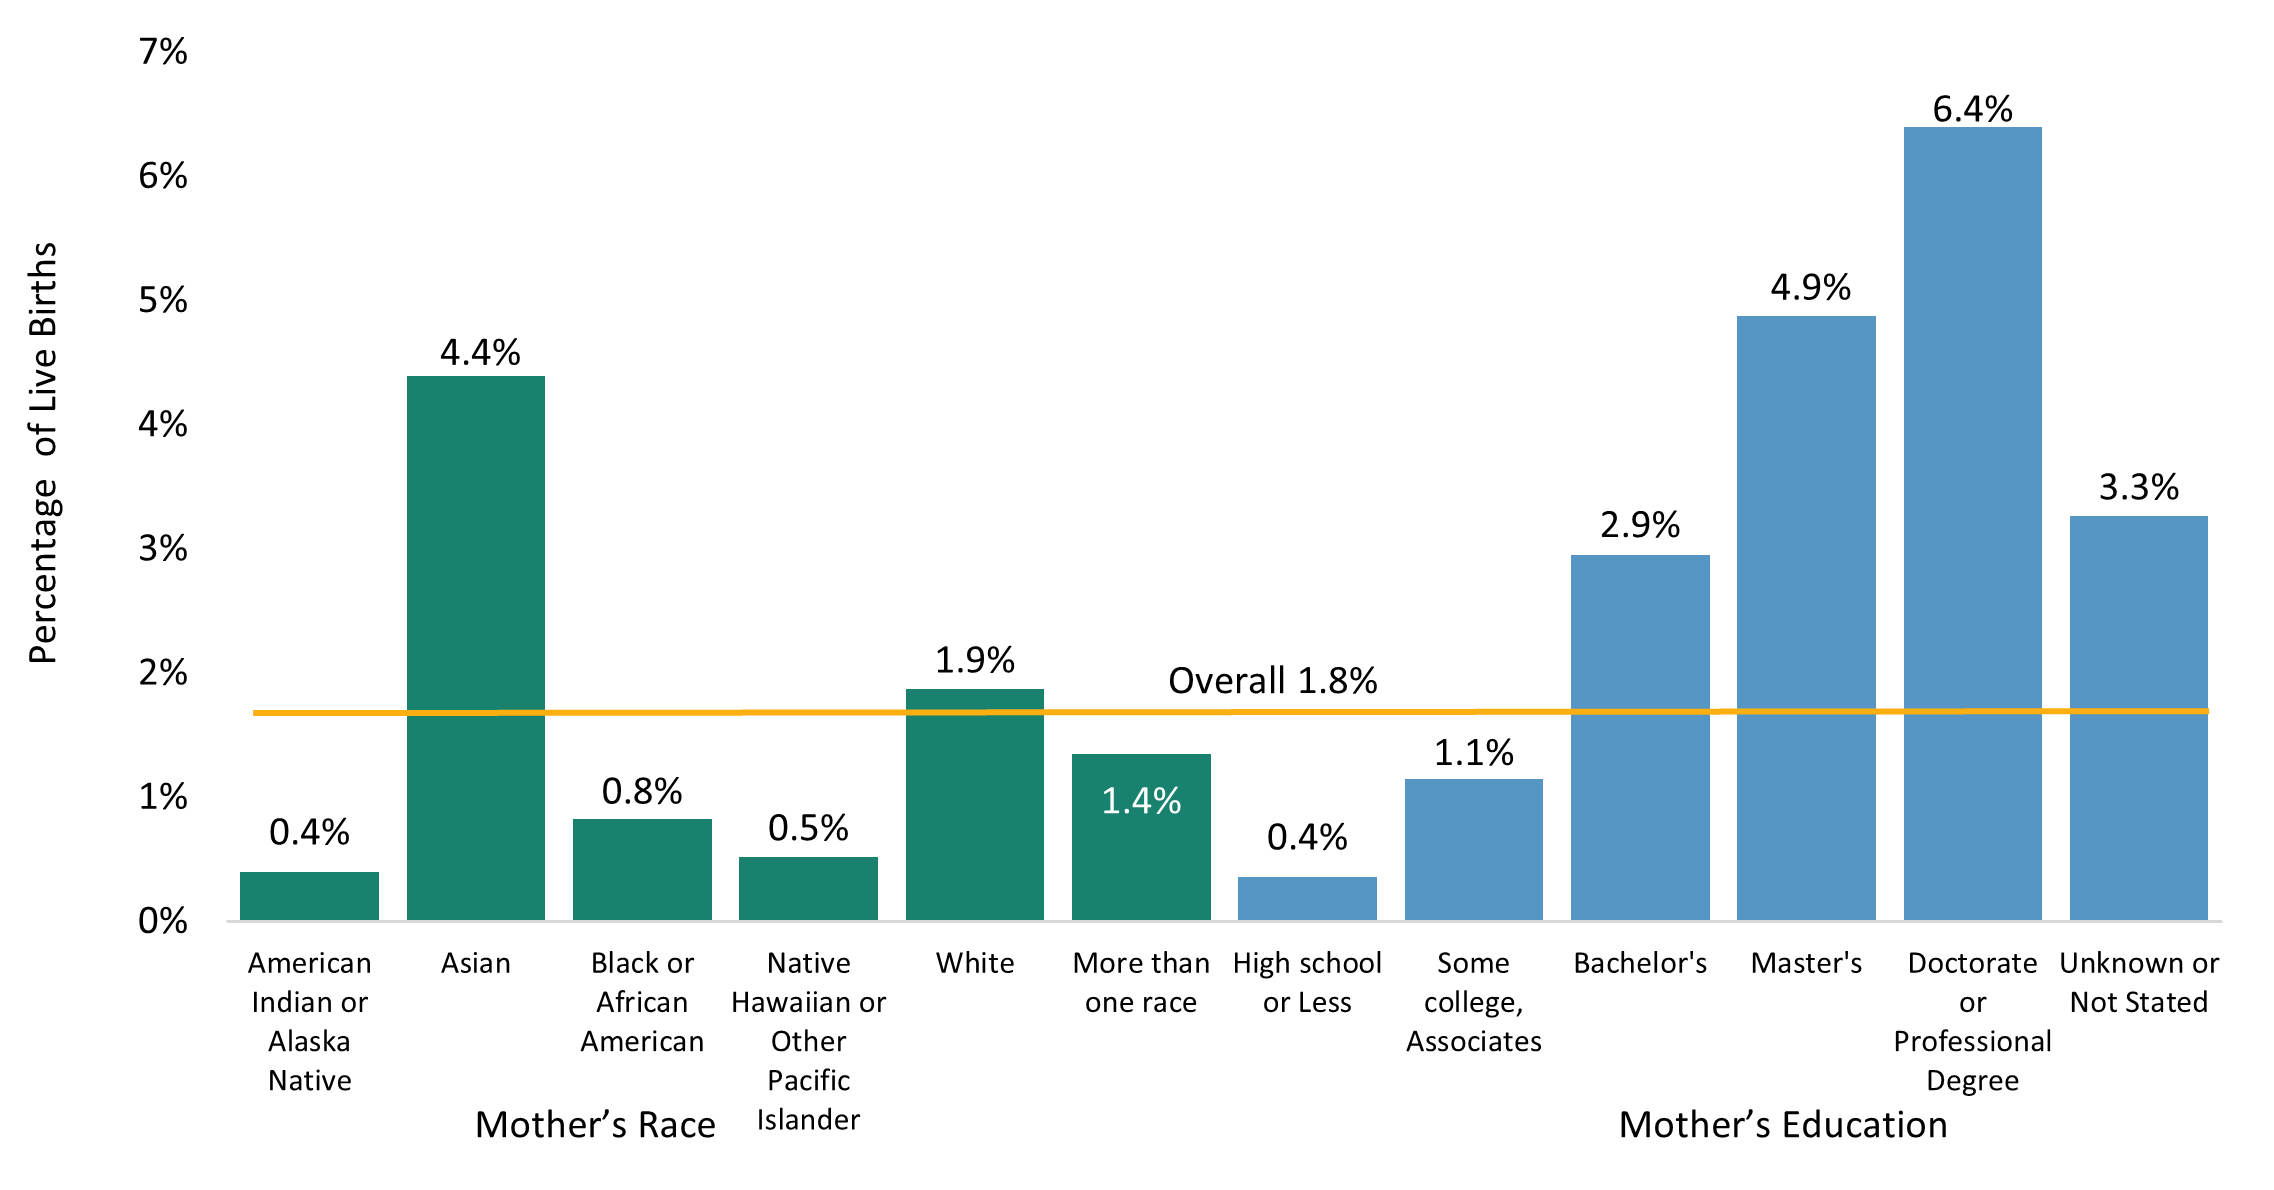
Source: Centers for Disease Control and Prevention, National Center for Health Statistics. National Vital Statistics System, Provisional Natality on CDC WONDER Online
Database. Data are from the Natality Records 2023 through Last Month, as compiled from data provided by the 57 vital statistics jurisdictions through the Vital Statistics Cooperative Program. Accessed at http://wonder.cdc.gov/natality-expanded-provisional.html on Feb 28, 2024.
Note: ART use has been found to be underreported in natality records.
Legal Disclaimer:
EIN Presswire provides this news content "as is" without warranty of any kind. We do not accept any responsibility or liability for the accuracy, content, images, videos, licenses, completeness, legality, or reliability of the information contained in this article. If you have any complaints or copyright issues related to this article, kindly contact the author above.
