
Massachusetts Monthly Unemployment Claimant Data for the month ending February 5, 2022
Massachusetts — MONTHLY UNEMPLOYMENT CLAIMANT DATA
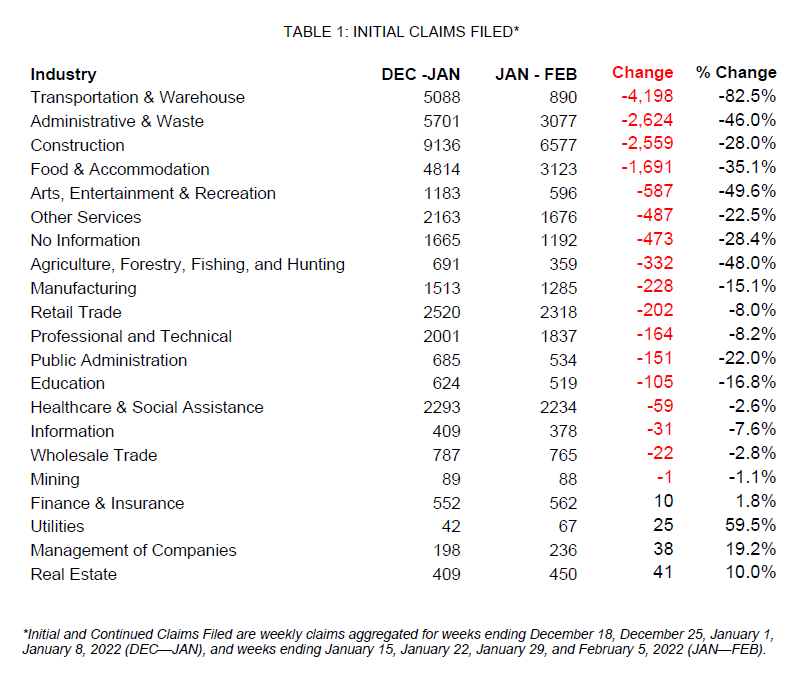
BOSTON, MA—February 17, 2022—Massachusetts had a total of 28,486 initial claims for regular Unemployment Insurance (UI) between January 9th and February 5th, 2022, a reduction of 13,791 claims from the previous four weeks. The largest decreases were seen in: Transportation and Warehouse, down 4,198 claims; Administration & Waste, down 2,624 claims; Construction, down 2,559 claims; and Food & Accommodation, down 1,691 claims.
Continued weeks claimed increased by a total of 41,413 from the previous month to 301,057. The largest increases were seen in Construction, up 19,419 claims; Administrative & Waste, up 9,660 claims; and Food & Accommodation, up 5,616 claims. The Pandemic Unemployment Assistance (PUA) program, which was implemented on May 21, 2020, had a total of four initial claims filed and 2,235 continued weeks claimed, a drop of 875 continued weeks claims from the four weeks prior. The PUA benefits program ended on September 4, 2021.
The Pandemic Emergency Unemployment Compensation (PEUC), which was implemented on May 21, 2020, had a total of 74 initial claims. Continued weeks claimed dropped by 241 to 546. The PEUC program ended on September 4, 2021.
The federal/state Extended Benefits (EB) program which triggered off on July 17, 2021, had no change in initial claims from the previous month while total continued weeks claimed increased by one.
The Federal Pandemic Unemployment Compensation (FPUC) which was implemented on May 21, 2020 and provided an additional $300 a week on top of regular benefits also ended on September 4, 2021.
NOTE: Following the termination of pandemic assistance (PUA, FPUC, PEUC) and long-term benefit (EB) programs, claims reports will be published in conjunction with the Massachusetts Unemployment and Job Estimates monthly releases, at mass.gov/lwd in the News and Updates section. Weekly UI claims reporting can be found at https://www.dol.gov/ui/data.pdf.
In contrary to initial claims trends last month, Transportation and Warehousing saw the greatest decline of more than 80% in initial claims over month of January going into February. Administrative and Waste Management, Construction, and Food and Accommodation sectors also saw major drops in initial claims during this period—a decrease of more than 1,600 initial claims in each sector. Relatively few sectors saw increases in initial claims. Notably, the Utilities sector saw an almost 60% increase initial claims over the month.
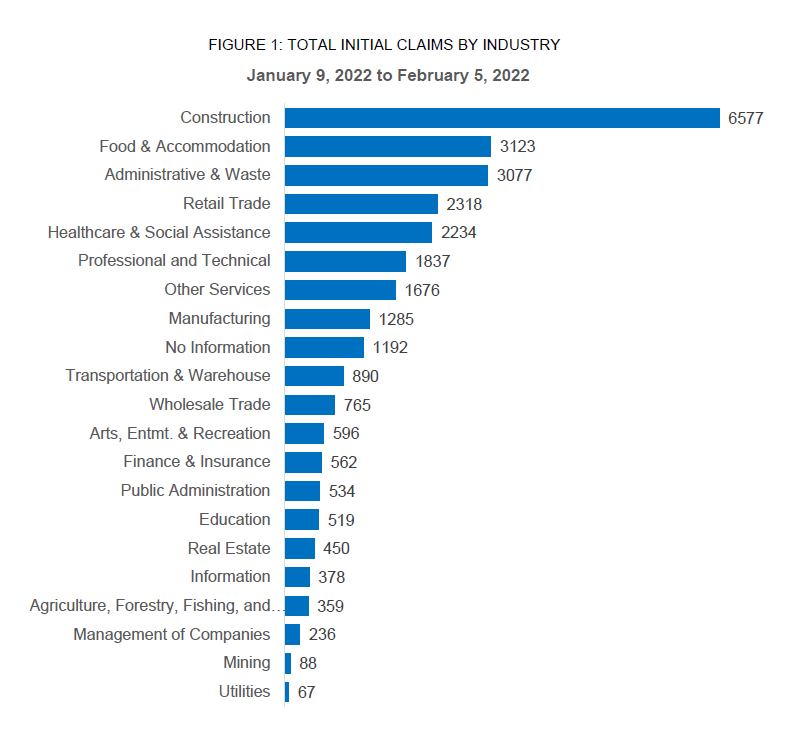
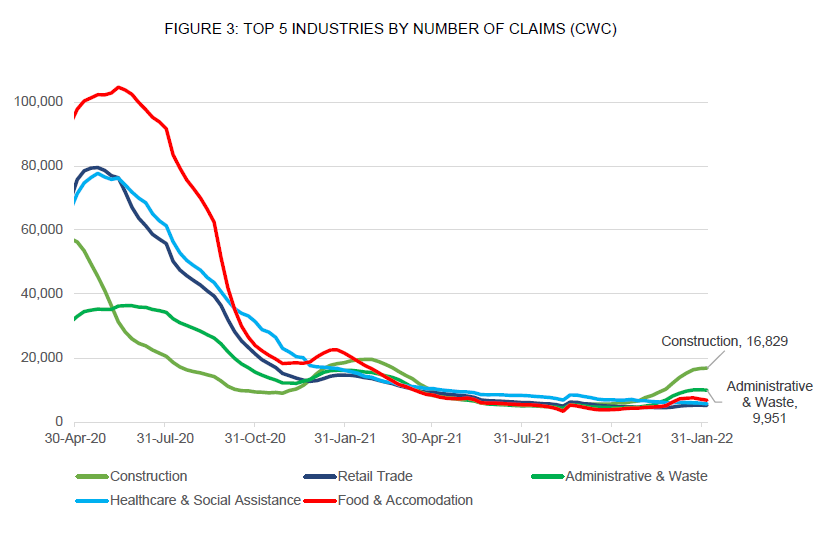
Despite the almost 30% decline initial claims, Construction continues to take the lead in initial claims over the month of January to February. The industries with the highest number of continued claims after Construction include Food and Accommodation and Administrative and Waste Management. Those that saw the greatest increases over the month include Real Estate, Management of Companies, and Utilities, while Transportation and Warehousing saw the greatest decline, as mentioned above.
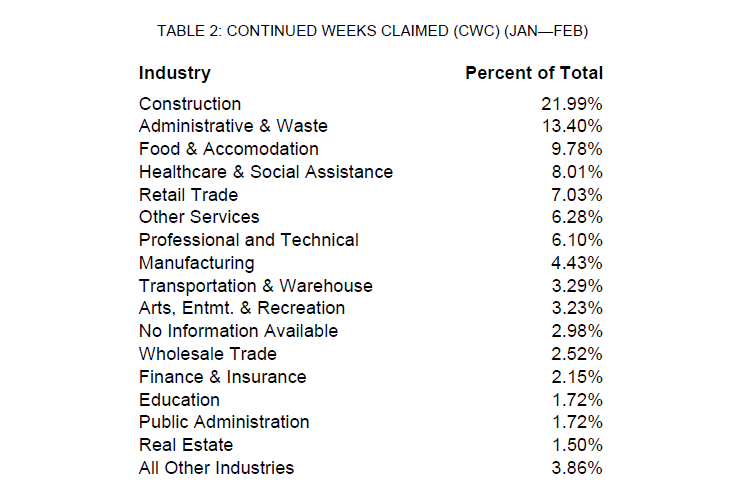
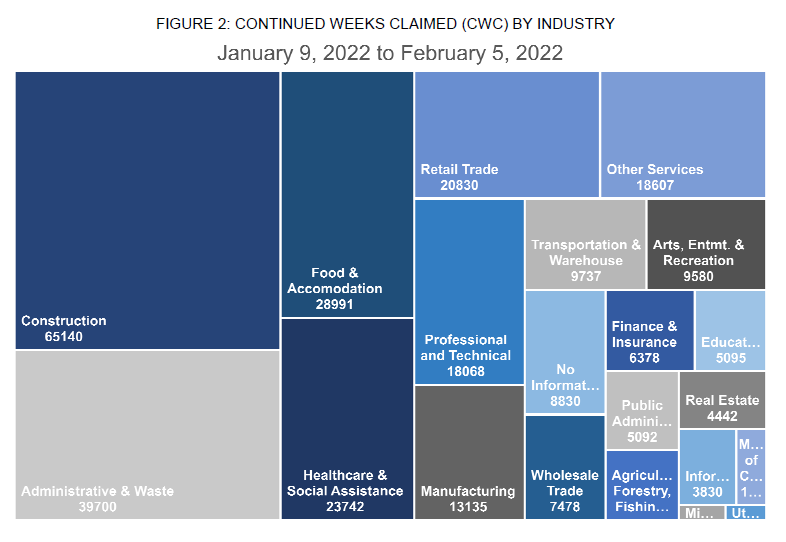
At the peak of the pandemic, the industries with the highest of continued claims were Construction, Retail Trade, Food and Accommodation, Health Care and Social Assistance, and Other Services. Construction, Administrative and Waste Management, and Food and Accommodation sectors see cyclical increases as expected during the months of January and February. The steady decline in continued claims in other sectors could be due to the unemployed reaching their 26-week benefit limit or switching to different sectors. Most continued claims over the month of January came from the Construction, which saw an increase of more than 2,800 continued claims from early January to February, 2022.
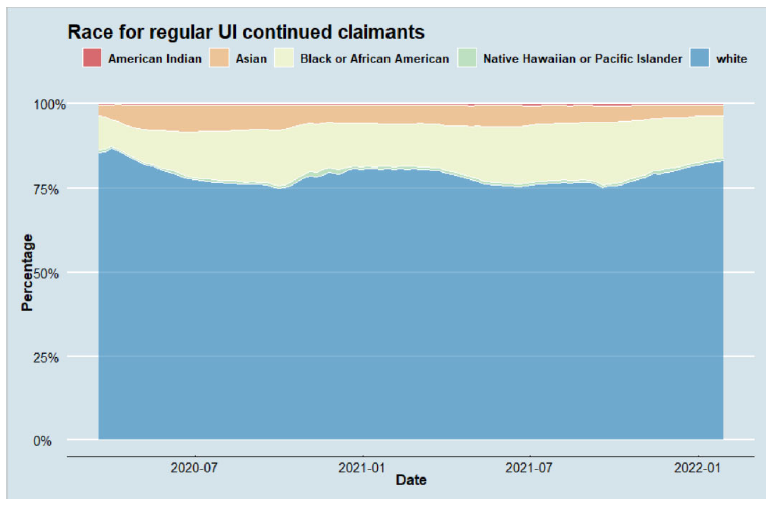
DEMOGRAPHIC BREAKDOWNS Below we present demographic statistics on ethnicity, gender, and race for all those claimants who filed for a continued week. Due to the timing of data availability, the below statistics reflect average continued weeks claimed over four weeks, from the week ending January 8th to the week ending January 29th, 2022, rather than the week ending February 5th, 2022. All demographic figures are presented as a percentage of claimants who responded, excluding claimants for whom the information was not available.
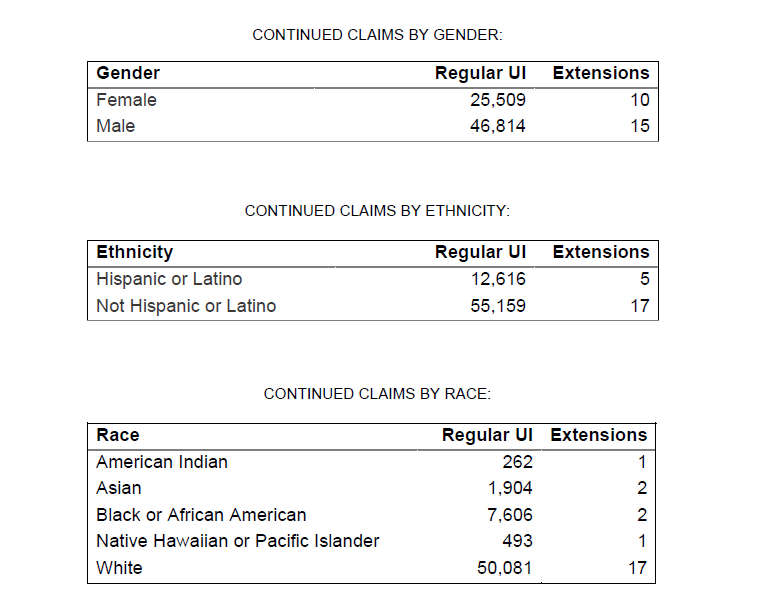
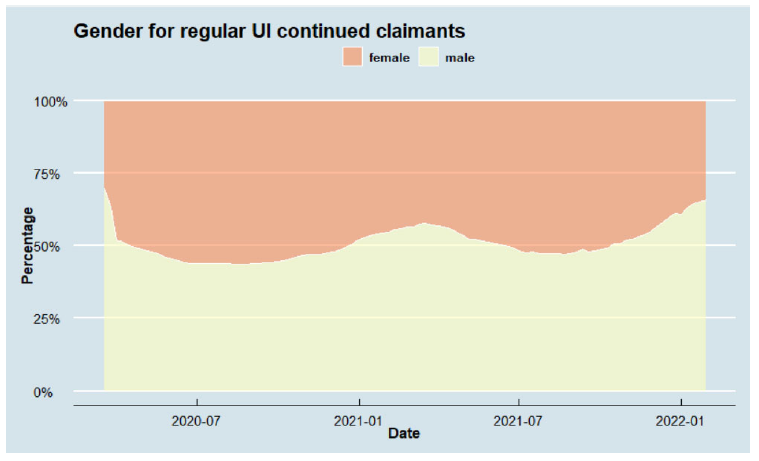
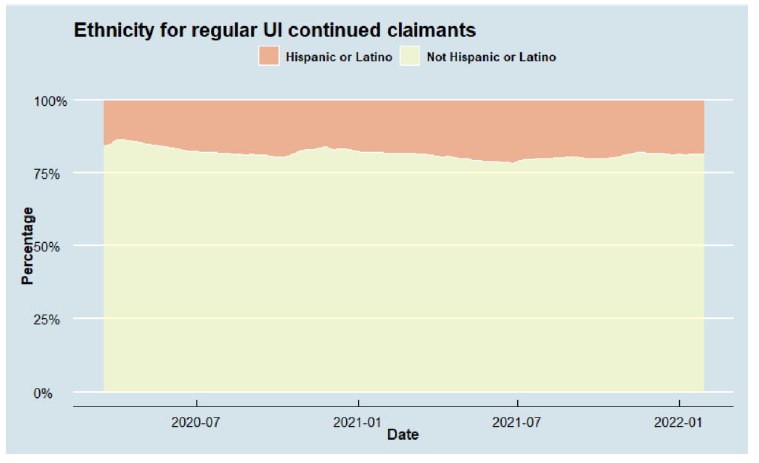
REGULAR UI DEMOGRAPHIC FIGURES Here we present the breakdown by gender, ethnicity, and race of continued claims for Regular UI between March 8th, 2020 and January 29th, 2022:
UI EXTENSIONS DEMOGRAPHIC FIGURES This series is discontinued because the weekly sample sizes of continued claims for the PEUC and EB programs, which covered the long term unemployed, are too small to be accurately represented graphically.
###
Legal Disclaimer:
EIN Presswire provides this news content "as is" without warranty of any kind. We do not accept any responsibility or liability for the accuracy, content, images, videos, licenses, completeness, legality, or reliability of the information contained in this article. If you have any complaints or copyright issues related to this article, kindly contact the author above.
