
Massachusetts Monthly Unemployment Claimant Data for the month ending December 11, 2021
MASSACHUSETTS — Massachusetts Monthly Unemployment Claimant Data
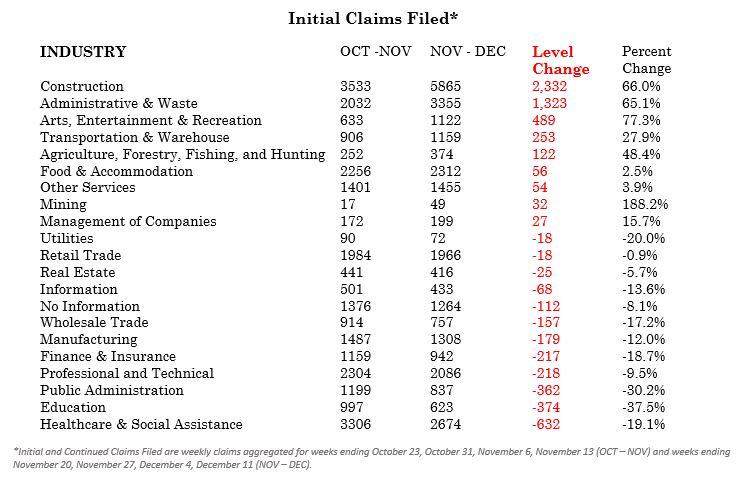
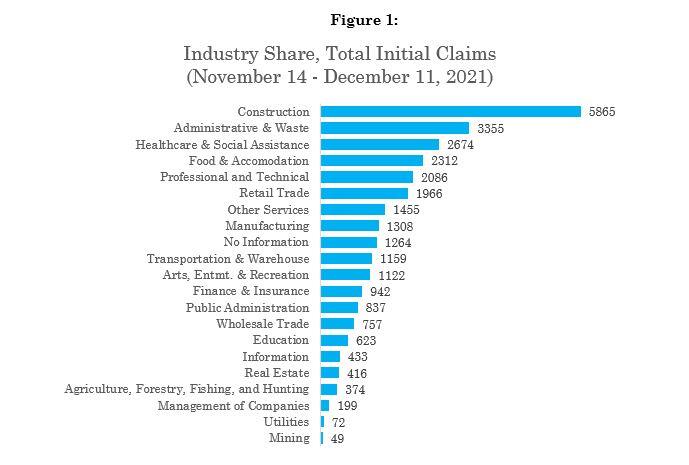
Massachusetts had 28,920 individuals file an initial claim for regular Unemployment Insurance (UI) between November 14th and,2021, an increase of 2,485 claims from the previous four weeks aggregated. The largest increases were seen in: Construction, up 2,332 claims; Administrative and Waste, up 1,323; and Arts, Entertainment, and Recreation, up 489 claims.
Continued weeks claimed increased by 10,599 from the previous four weeks to 221,257 between November 13th to December 11th. The largest increases were seen in Construction, up 5,656 claims; Food & Accommodation, up 2,214 claims; and Arts, Entertainment, and Recreation, up 1,767 claims.
The Pandemic Unemployment Assistance (PUA) program, which was implemented on May 21,2020, had 2 initial claims filed and 3,065 continued weeks claimed, a decrease of 9,742 from the four weeks prior. The PUA benefits program ended on September 4, 2021.
The Pandemic Emergency Unemployment Compensation (PEUC), which was implemented on May 21, 2020, had 76 initial claims. Continued weeks claimed decreased by 625 to 1,019. The PEUC program ended on September 4, 2021.
The federal/state Extended Benefits (EB) program which triggered off on July 17 had no initial claims since week ending October 9th, 2021. There was a correction of 5 continued weeks claimed last month, which increased by 14 to 19 continued weeks claimed between November 14th and December 11th.
The Federal Pandemic Unemployment Compensation (FPUC) which was implemented on May 21,2020 and provided an additional $300 a week on top of regular benefits also ended on September 4, 2021.
NOTE: Following the termination of pandemic assistance (PUA, FPUC, PEUC) and long-term benefit (EB) programs, claims reports will be published in conjunction with the Massachusetts Unemployment and Job Estimates monthly releases, at mass.gov/lwd in the News and Updates section. Weekly UI claims reporting can be found at https://www.dol.gov/ui/data.pdf.
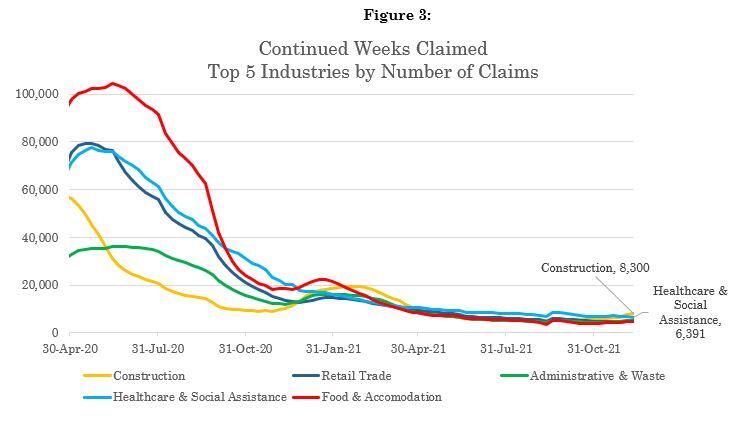
Consistent with Initial Claims filed over the last four weeks: the industries with the highest number of continued claims include Construction, Health Care and Social Assistance, Retail Trade, and Administrative and Waste. However, Health Care and Social Assistance and Retail Trade industries saw the largest decrease in continued claims over the month while Construction and Food and Accommodation Services had the greatest level increase.
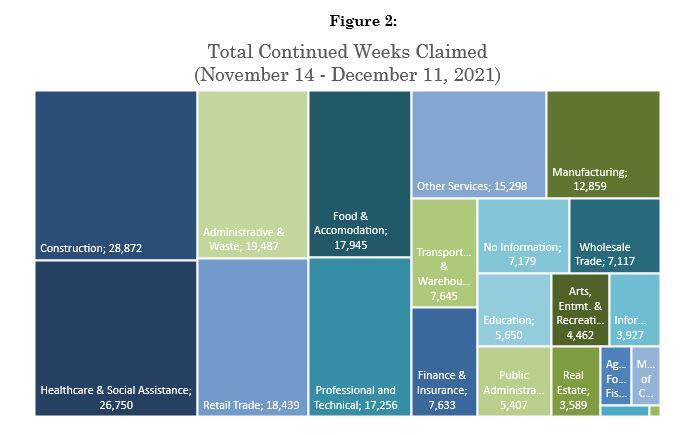
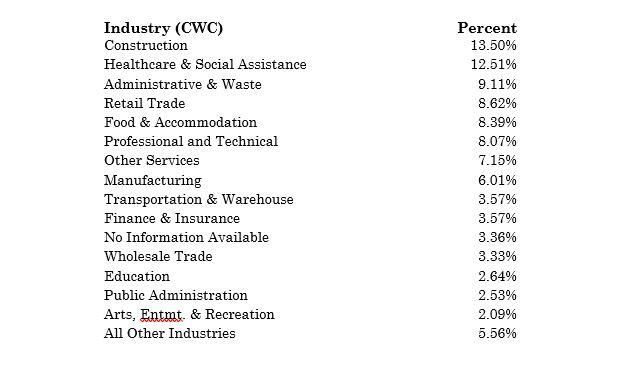
At the peak of the pandemic, the industries with the highest of continued claims were Construction, Retail Trade, Food and Accommodation, Health Care and Social Assistance, and Other Services. The steady decline in continued claims could be due to the unemployed reaching their 26-week benefit limit or switching to different sectors. Most continued claims over the month of November to December came from the Construction and Health Care and Social Assistance sectors.
Demographic Breakdowns
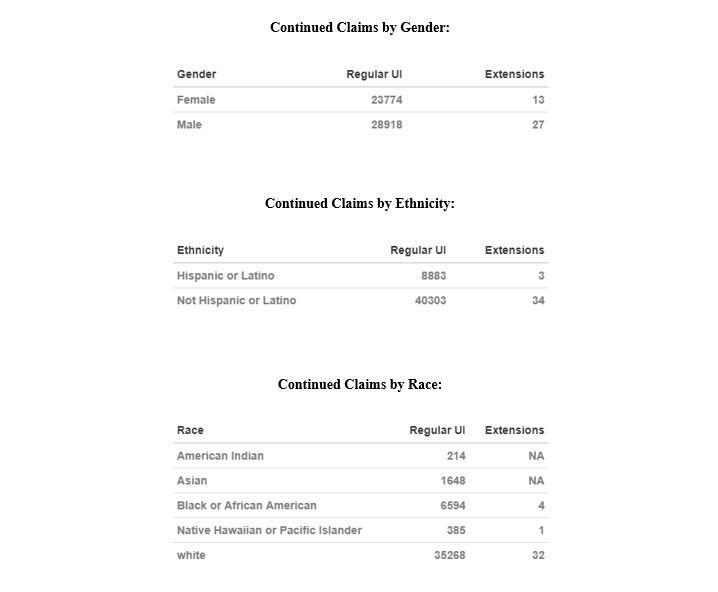
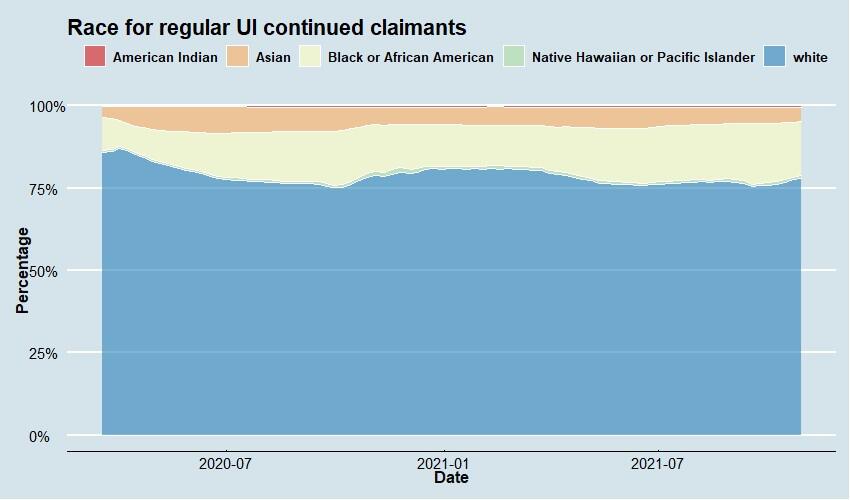
Below we present demographic statistics on ethnicity, gender, and race for all those claimants who filed for a continued week in the period prior to the above information. This is to say that because of the timing of data availability, the below statistics reflect continued weeks claimed in the week ending November 27th rather than the week ending December 11th. All demographic information is presented as a percentage of claimants who responded, excluding claimants for whom the information was not available.
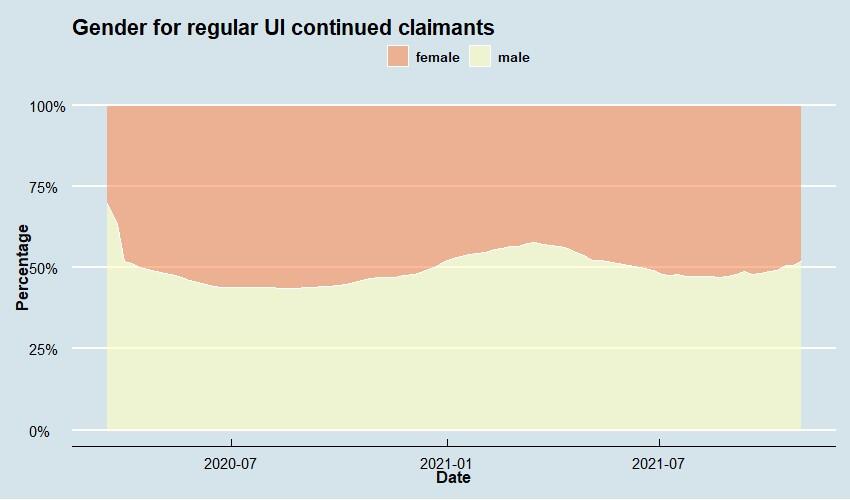
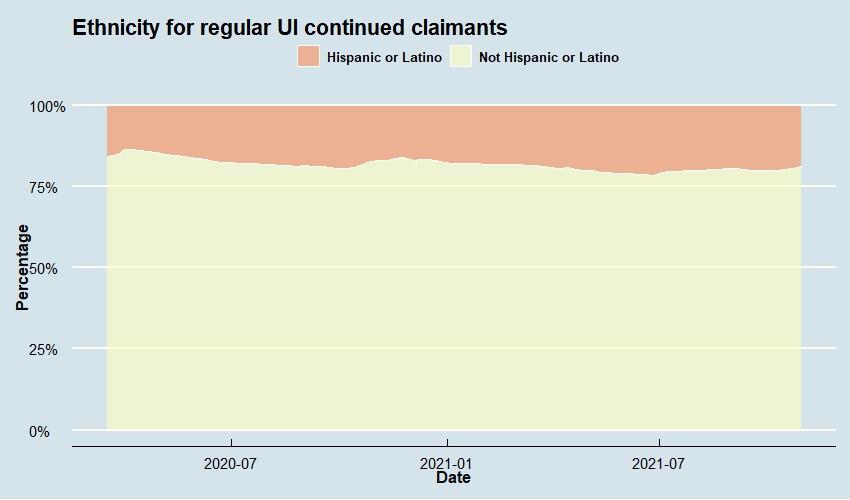
Regular UI Demographic Series
Here we present the breakdown by gender, ethnicity, and race of continued claims for Regular UI between March 8th, 2020 and November 27th, 2021:
UI Extensions Demographic Series
This series is discontinued because the number of continued claims for the PEUC and EB programs, which cover the long term unemployed, are too small to be accurately represented graphically.
###
Legal Disclaimer:
EIN Presswire provides this news content "as is" without warranty of any kind. We do not accept any responsibility or liability for the accuracy, content, images, videos, licenses, completeness, legality, or reliability of the information contained in this article. If you have any complaints or copyright issues related to this article, kindly contact the author above.
