1,800+ COVID-19 research graphs on GIDEON: cases, deaths, worldwide, country-specific, and more
The world urgently needs more research on COVID-19. Only then can we battle, not just SARS-CoV-2, but all emerging infectious diseases.”
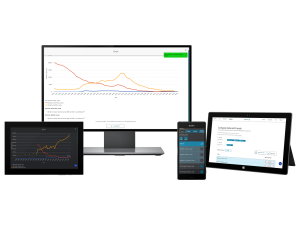
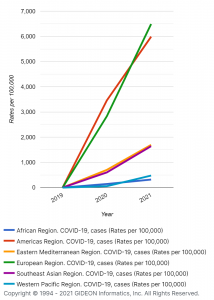
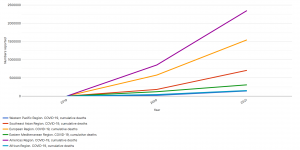
LOS ANGELES, CALIFORNIA, UNITED STATES, December 14, 2021 /EINPresswire.com/ -- Over 1,800 charts have been added to the robust GIDEON epidemiology database and diagnostic toolkit. Now, researchers can download ready-to-use graphs on SARS-CoV-2 cases, cumulative cases, cumulative case rates per 100,000 persons, deaths, mortality rates, cumulative death rates by country, region, or worldwide. GIDEON also supports the creation of custom charts to compare data from one country or region versus another over time. — Stephen A. Berger, MD
“The world urgently needs more research on COVID-19. Only then can we battle, not just SARS-CoV-2, but all emerging infectious diseases,” states Dr. Steve, Berger, Co-Founder and Medical Advisor of GIDEON Informatics. “GIDEON offers ready-to-use and customizable COVID-19 charts. With these, we can help researchers spend less time gathering resources - and more time analyzing and publishing their insight.”
Over 200 publications, and counting, have already leveraged the GIDEON database for their infectious disease and epidemiology-related research.
Academics, public health officials, and students can use the recently added COVID-19 charts to learn:
• How the United States compares to Europe, the UK, or the world in COVID-19 cases or mortality rates,
• How Germany or France fared versus the rest of Europe during the pandemic,
• The difference between developed regions and developing regions,
• How the global spread of COVID-19 compares to other infectious diseases like malarial infections,
• Finland’s COVID-19 cases compare to past infectious disease outbreaks in the country, and much more.
This data can also provide background and context to all types of COVID-19 research. These include publications on the effectiveness of countrywide public health policies like lockdowns, quarantines, social distancing, mask guidelines, and other population health studies.
Apart from COVID-19, the GIDEON Quantify module offers 38,000+ graphs on prevalence, incidence, and mortality for over 360 infectious diseases. The GIDEON database is comprehensive and draws from millions of data points from 235 countries and territories.
For more information, visit www.gideononline.com or contact info@gideononline.com
About GIDEON:
GIDEON Informatics exists to advance the global effort against Infectious Disease. The company was founded in 1992 and produced the GIDEON web application and an ebook series for health professionals and educators.
GIDEON toolkit helps protect society by providing reliable, timely epidemiological data. The application saves doctors precious time in diagnosing and treating infectious diseases and provides state-of-the-art tools to train the healthcare workers of tomorrow.
Hundreds of customers worldwide, including educational institutions, hospitals, public health departments, and microbiology laboratories, choose GIDEON as their diagnosis-and-reference tool for Infectious Diseases and Microbiology.
Kristina Symes
GIDEON Informatics
+1 323-925-4925
info@gideononline.com
Legal Disclaimer:
EIN Presswire provides this news content "as is" without warranty of any kind. We do not accept any responsibility or liability for the accuracy, content, images, videos, licenses, completeness, legality, or reliability of the information contained in this article. If you have any complaints or copyright issues related to this article, kindly contact the author above.


