
2024 Proxy Season Review: Compensation-Related Matters
Support for management say-on-pay proposals remained high
- The number of failed say-on-pay votes reached a ten-year low across both the S&P 500 and the Russell 3000
- Overall shareholder support averaged 90% among the S&P 500 and 91% among the Russell 3000 in H1 2024 (vs. 88% and 90% in H1 2023)
ISS recommendations meaningfully impacted shareholder votes on say-on-pay proposals
- Compared to proposals ISS supported, proposals with negative recommendations received 27% and 23% lower support on average, respectively, at S&P 500 and Russell 3000 companies
- Alignment of CEO pay with relative total shareholder return remained the most important quantitative factor underlying ISS negative recommendations
- Although use of above-target payouts became the most often cited qualitative factor underlying ISS negative recommendations, ISS appeared to place greater emphasis on other qualitative factors when making such recommendations, including the use of limited, opaque or undisclosed performance goals
Companies received six proposals requesting binding shareholder approval of director compensation
- These proposals were all excluded through the SEC no-action process on the basis of “violation of law”
Shareholder support for equity compensation plans was consistent with H1 2023
- Average support was 92% among the S&P 500 and 88% among the Russell 3000 in H1 2024 (vs. 91% and 87% in H1 2023)
- All plans passed among the S&P 500 and five failed among the Russell 3000 (same as H1 2023)
Say-on-pay voting results remained strong in 2024. The number of failed votes reached a ten-year low across both the S&P 500 and the Russell 3000. Specifically, the number of companies with failed say-on-pay votes decreased by 73 percentage points among S&P 500 companies (three vs. 11 in H1 2023) and by 41 percentage points among Russell 3000 companies (26 vs. 44 in H1 2023).
Across both indices, 99% of say-on-pay proposals passed (vs. 98% for both indices in H1 2023). Average shareholder support for say-on-pay proposals voted in H1 2024 was 90% among the S&P 500 and 91% among the broader Russell 3000, up slightly compared to 88% and 90%, respectively, in H1 2023. Looking at the S&P 500 companies broken down by industry, those in the technology sector had the lowest average support at 87% and those in the energy/utilities sector had the highest average support at 93%. The only S&P 500 companies with failed say-on-pay votes were in the technology and industrial sectors.
There continued to be significant year-over-year turnover in failed votes, particularly among S&P 500 companies. Of the S&P 500 companies that had their say-on-pay votes in H1 2024, all 11 companies with failed 2023 say-on-pay votes achieved majority support (vs. 14 out of 17 in H1 2023), with eight companies receiving shareholder support of over 70% of votes cast. [2] Among the broader Russell 3000 that had their say-on-pay votes in H1 2024, 34 out of the 40 Russell 3000 companies with failed 2023 say-on-pay votes achieved majority support (vs. to 47 out of 72 in H1 2023), and 24 had support levels over 70%. In addition, of the 26 companies in the Russell 3000 that had failed say-on-pay votes in H1 2024, six had a failed vote in the prior year and six additional companies had support levels below 70% in the prior year (compared to nine and six out of 44 in H1 2023, respectively). Overall, these numbers indicate that companies with failed votes continue to be successful in implementing changes that result in better say-on-pay outcomes in the subsequent year.
Consistent with prior years, ISS recommendations meaningfully impacted shareholder votes. Compared to the proposals supported by ISS, say-on-pay proposals with negative ISS recommendations received 27% and 23% lower support on average, respectively, at S&P 500 and Russell 3000 companies. As further discussed below, the most significant factors underlying ISS’s negative recommendations in 2024 were the misalignment between CEO pay and shareholder return, as well as the use of above-target payouts and limited, opaque or undisclosed performance goals. ISS is likely to remain focused on these performance-related compensation concerns in 2025 in light of the continued economic uncertainty facing global markets.
B. OVERALL ISS APPROACH ON SAY-ON-PAY EVALUATION

When making a recommendation on a say-on-pay proposal, ISS uses a multipronged approach to assess executive compensation. [4] ISS will recommend a vote against a company’s say-on-pay proposals if any of the following is true:
- there is a significant misalignment between CEO pay and company performance (pay-for-performance), as discussed in detail in Section C below;
- the company maintains significant problematic pay practices (for example, excessive change-in-control or severance packages, benchmarking compensation above peer medians, repricing or backdating of options, or excessive perquisites or tax gross-ups); or
- the board’s communication with and responsiveness to shareholders are significantly poor.
ISS applies these standards by assigning companies a “high”, “medium” or “low” level of concern for each of the five evaluation criteria listed in the above table. As the table illustrates, although pay-for-performance is just one factor in the overall compensation assessment, it remains the main factor correlating to ISS’s negative recommendation on the say-on-pay vote, as has been the case in recent years. In fact, the percentage of negative recommendation reports indicating “high” concern on this issue continued to increase year over year (91% vs. 90% in H1 2023, compared to 80% in H1 2022).
Consistent with 2023, ISS also issued negative recommendations based on perceived issues with compensation committee communication and responsiveness, highlighting the importance of engagement with shareholders on matters relating to compensation. [5] Of the six companies that received both a negative recommendation and a “high” concern rating on compensation committee communication and responsiveness, two companies had a “high” concern solely under this criterion. [6] Another company received a rating of “low” concern with respect to pay-for-performance (and another two received a “low” initial quantitative concern rating with respect to pay-for-performance).
In H1 2024, severance was the most prevalent issue underlying compensation-related Rule 14a-8 proposals, representing 41% of total submissions on compensation (see Section G.1 of Part 1 of this memo). ISS also seemed increasingly focused on severance arrangements, ascribing “high” concern on this criterion to four companies to which it issued negative recommendations in H1 2024 (vs. two in H1 2023).
C. DETAILS ON ISS’S APPLICATION OF ITS PAY-FOR-PERFORMANCE POLICIES IN H1 2024
Since the 2012 proxy season, the first step in the pay-for-performance prong of ISS’s executive compensation assessment has been a quantitative analysis of both relative and absolute alignment of pay-for-performance. [7] Even if a company receives a “low” concern rating through this quantitative pay- for-performance model, ISS will review all of the company’s Compensation Discussion and Analysis sections and incentive programs to highlight noteworthy issues to investors. Problematic incentive designs, such as multi-year guaranteed payments, discretionary pay components, inappropriate perquisites, or lack of rigorous goals are generally addressed in the qualitative analysis and may result in a “high” overall concern with respect to pay-for-performance despite a “low” initial quantitative concern level. [8]
1. Components of Quantitative Analysis
ISS’s quantitative pay-for-performance screen uses four measures, which were slightly modified in December 2023:
- Relative Degree of Alignment, or RDA (relative alignment of CEO pay and total shareholder return over three years). The metric that is given the greatest weight in the quantitative assessment is the alignment of CEO pay and TSR, [9] relative to a comparison group of 12–24 companies selected by ISS on the basis of size, industry, market capitalization and other factors. To determine RDA, the company’s percentile ranks are calculated for three-year average pay and for annualized three-year TSR performance. The RDA measure is equal to the difference between the ranks: the performance rank minus the pay rank. The threshold for receiving “high” concern is a difference of 60 percentile points or more. This metric continued to be the strongest predictor of ISS recommendations and of overall voting results. Of the 34 S&P 500 companies that received a negative ISS recommendation on say-on-pay, 18 received a “high” concern for RDA (compared to 15 out of 42 companies in H1 2023).
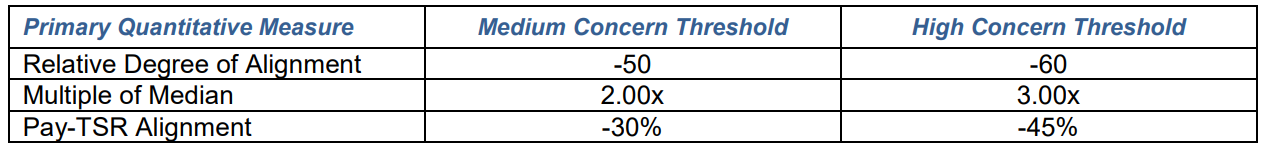
- Multiple of Median, or MOM (relative CEO pay to peer group median over one year). This metric considers pay independent of company performance. This metric is calculated by dividing the company’s one-year CEO pay by the median pay for the comparison group. ISS’s scoring system may trigger a “high” concern if this multiple is 3.00x or higher for S&P 500 companies (3.33x or higher for non-S&P 500 companies). ISS research reports also include a three-year MOM; the three-year MOM is not part of the quantitative screen methodology but may inform ISS’s qualitative evaluation.
- Pay-TSR Alignment, or PTA (absolute alignment of CEO pay and TSR over five years). The third component measures alignment between the long-term trend in the CEO’s pay and the company’s shareholder returns. This does not depend on year-by-year sensitivity of CEO pay to changes in TSR, but instead compares the slopes of weighted linear regressions for pay and for shareholder returns over a five-year period. A “high” concern may be triggered if the CEO pay trend slope exceeds the TSR trend slope by 45 percentage points or more.
- Financial Performance Assessment, or FPA (relative alignment of CEO pay and financial performance over three years). The FPA relative measure is applied as a secondary measure after the three primary screens above are calculated. It compares the percentile ranks of a company’s CEO pay and financial performance across four Economic Value Added (EVA) metrics, relative to an ISS-derived comparison group, over the prior two-year or three-year period. The FPA requires a minimum two-year period of CEO pay and EVA data; if insufficient data exists for either metric, the FPA screen will be excluded. The FPA screen generally utilizes four equally weighted EVA-based metrics: (1) EVA margin; (2) EVA spread; (3) EVA momentum vs. sales; and (4) EVA momentum vs. capital.
The “medium” concern and “high” concern thresholds for non-S&P 500 companies are summarized below.
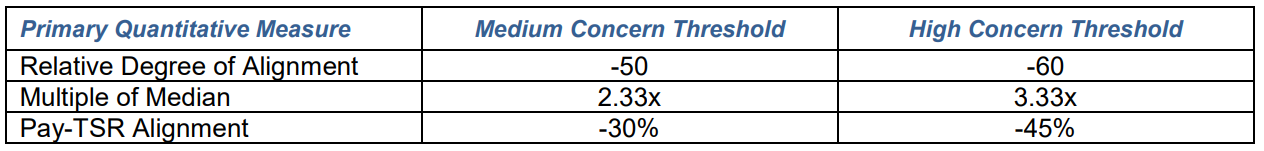
For S&P 500 companies, the MOM “medium” and “high” concern thresholds are slightly lower, likely due to greater investor scrutiny on CEO compensation among large-cap companies. The “medium” concern and “high” concern thresholds for S&P 500 companies are summarized below.
Based on the preceding, ISS will assign an initial quantitative score (ISS may deem multiple “medium” concern levels as the equivalent of an overall “high” quantitative concern). ISS then applies the FPA score as a potential modifier. The FPA could modify the initial score (a) if a company has a “medium” concern under any of the three primary measures, (b) if a company has a “low” concern that borders on a “medium” concern threshold under any of the three primary measures, or (c) if a company has only one individual elevated concern (“medium” or “high”) under the three primary measures (e.g., certain “medium” concern companies with poor FPA performance may become “high” concerns). [10]
2. Results of ISS Quantitative Analysis in H1 2024
In H1 2024, 10 companies out of the 34 that received a negative recommendation on their say-on-pay proposals did so despite attracting only “low” overall concern on the quantitative screen (vs. nine out of 42 in H1 2023 and 13 out of 50 in H1 2022). Only two of these companies received a negative recommendation despite attracting “low” overall concern on both the quantitative and qualitative screens (same as H1 2023, compared to six in H1 2022). These results appear to suggest that, in issuing a negative recommendation against a company’s say-on-pay proposal, ISS continues to place a greater emphasis on its quantitative factors. Interestingly, in 2024, the FPA had a greater impact on ISS’s analysis of the pay-for-performance concerns of companies with higher initial concern levels, resulting in four companies being moved from “medium” to “high” concern (vs. two companies in H1 2023). No companies moved from “low” to “medium” concern as a result of the FPA (vs. five companies in H1 2023). Twenty-one of the companies that received a negative recommendation remained at the same level of concern as they were following the RDA, MOM, and PTA tests.
3. ISS Qualitative Analysis
Under ISS’s policies, the qualitative review takes into account a range of factors, including:
- the ratio of performance- to time-based incentive awards; the overall ratio of performance-based compensation to fixed or discretionary pay;
- the transparency and clarity of disclosure;
- the complexity of the pay program;
- any risks associated with the pay program design;
- the emphasis of objective and transparent metrics;
- the rigor of performance goals;
- the application of compensation committee discretion;
- the magnitude of pay opportunities;
- the company’s peer group benchmarking practices;
- financial/operational results, both absolute and relative to peers, including clear disclosure in the proxy of any adjustments made for incentive plan purposes;
- special circumstances such as CEO and executive turnovers or unusual grant practices (e.g., biannual awards, special one-time grants);
- recent pay program changes and/or any forward-looking commitments;
- realizable and realized pay compared to granted pay; and
- any other factors ISS deems to be relevant.
Of the 34 S&P 500 companies that received negative ISS recommendations on say-on-pay in H1 2024, ISS described 24 companies as providing above-target payouts, which can be suggestive of weak performance standards (vs. 20 out of 42 in H1 2023). Although this was the most frequently cited qualitative factor in ISS’s negative recommendations this year, in many cases ISS did not specifically criticize the payouts, instead merely noting them as part of its overall assessment of performance-based compensation. For example, for 13 of the 24 companies identified as having above-target payouts that received negative recommendations, ISS also cited performance conditions that were not sufficiently rigorous. [11] This indicates that other factors may have a larger impact on ISS’s decision to recommend against a company’s say-on-pay proposal.
Similar to prior years, the inclusion of limited, opaque, or undisclosed performance goals was a significant qualitative factors in say-on-pay recommendations for S&P 500 companies in 2024. ISS specifically cited this concern for 19 of the 34 companies that received negative recommendations (vs. 24 of 42 in H1 2023). The continued significance of this qualitative factor is consistent with ISS’s focus on pay-for-performance alignment in the quantitative assessments. In addition, ISS was more focused on the use of subjective criteria for determining bonuses, or the use of discretion to increase an executive’s compensation, than it had been in prior years. ISS identified this as a qualitative factor for 17 of the 34 S&P 500 companies that received a negative recommendation in H1 2024 (vs. 16 of 42 in H1 2023). In some cases, companies used discretion to limit the impact of poor performance on outstanding equity awards, which ISS considers to be problematic.
The other concerns ISS identified generally fell into the following categories (with most companies receiving more than one of these concerns):
- Sizeable compensation. ISS cited the broad provision of outsized compensation, including through large base salaries and one-time, special cash or equity awards, for 17 of the 34 S&P 500 companies (vs. 18 of 42 in H1 2023). Certain companies were also criticized for granting multiple incentive awards that utilized identical performance metrics, resulting in high compensation for the same performance.
- Large perquisites. Thirteen of the 34 S&P 500 companies were criticized by ISS for providing excessive perquisites (vs. 19 of 42 in H1 2023). ISS specifically mentioned security services and aircraft use in seven and six of these cases, respectively. Other frequently mentioned perquisites include car services and tax gross-ups.
- The use of time-based incentive awards rather than performance-based incentive awards. ISS identified this concern at 12 of the 34 S&P 500 companies (vs. 13 of 42 companies in H1 2023). The failure by ISS to consider time-based vesting awards to be a robust measure of performance has been the subject of criticism because time-based equity awards can give holders a stake in the performance of the company and align the interests of executives with those of shareholders. However, awards granted subject to performance-based conditions are considered to be a matter of good governance by many stakeholders.
- The use of above-median peer group benchmarking practices. ISS criticized eight of the 34 S&P 500 companies for using above-median peer group benchmarking practices (vs. 19 of 42 in H1 2023). Specifically, ISS criticized the provision of compensation above the median level of the company’s identified peer group and the selection of a peer group with a greater average revenue than the company. In 2024, ISS also criticized three companies for granting long-term incentive awards to their CEO with a value exceeding the total pay for CEOs at the median company in ISS’s and/or the company’s selected peer group.
D. SHAREHOLDER PROPOSALS ON “SAY-ON-DIRECTOR-PAY”
In 2023, Tesla’s directors settled a derivative suit alleging that they approved excessive director compensation. Pursuant to the terms of the settlement, the directors agreed to submit directors’ compensation to an annual, binding shareholder vote. [12]
In H1 2024, six companies received Rule 14a-8 shareholder proposals requesting bylaw amendments to prohibit directors from receiving annual compensation greater than $1 unless such compensation has been approved by a majority of shareholders who are not directors. The six companies that received these proposals were VeriSign, McDonald’s, Lowe’s, eBay, UnitedHealth Group and General Motors, and all of the proposals were submitted by John Chevedden.
As further discussed in Section H of Part 1 of this memo, all six companies sought no-action relief rom the SEC with respect to these proposals, and the SEC ultimately permitted the exclusion of each proposal on the basis of “violation of law.” In each case, the SEC accepted the opinions of local counsel that the use of a bylaw amendment to exclude shareholders who also serve as a company’s directors from participating in a vote would contravene applicable state law, which mandates one vote for every share unless otherwise contemplated by the company’s certificate or articles of incorporation. [13]
Based on this proxy season’s outcomes, it seems unlikely that proponents will continue to submit the same proposals in the coming proxy seasons. However, given investors’ willingness to hold directors, particularly key committee chairs, accountable when expectations are not met, it is likely that proponents will continue to explore other so-called “accountability measures” for directors, including with respect to director compensation.
E. EQUITY COMPENSATION PLAN VOTING [14]
U.S.-listed companies generally are required under stock exchange rules to obtain shareholder approval for the plans under which they award equity-based compensation to employees, directors or other service providers. [15] Because shareholders generally support the use of equity compensation by public companies as a means to align the interests of employees with those of investors, in most cases these proposals are uncontroversial and pass by a wide margin. The support levels for these proposals usually average around 90%, and this proxy season was no different. Average support for equity compensation plan proposals voted in H1 2024 averaged 92% among the S&P 500 and 88% among the Russell 3000 in H1 2024 (vs. 91% and 87% in H1 2023).
Since 2015, ISS has applied an “equity scorecard” approach to assessing equity plans. The scorecard method considers factors under three main categories: [16]
- Plan cost. Cost is calculated as the Shareholder Value Transfer relative to industry/market-cap peers; this measures the dilutive effect of the new shares requested as well as shares remaining for issuance under existing plans (often called “dilution” or “overhang”), and is calculated both with and without outstanding unvested awards.
- Plan features. Specifically, penalizing lack of minimum vesting periods, broad discretionary vesting authority, liberal share recycling, lack of specific disclosure regarding change-in-control provisions, and the ability to pay dividends prior to the vesting of the underlying award.
- Grant practices. Specifically, three-year “burn rate” relative to market and industry peers, among other factors.
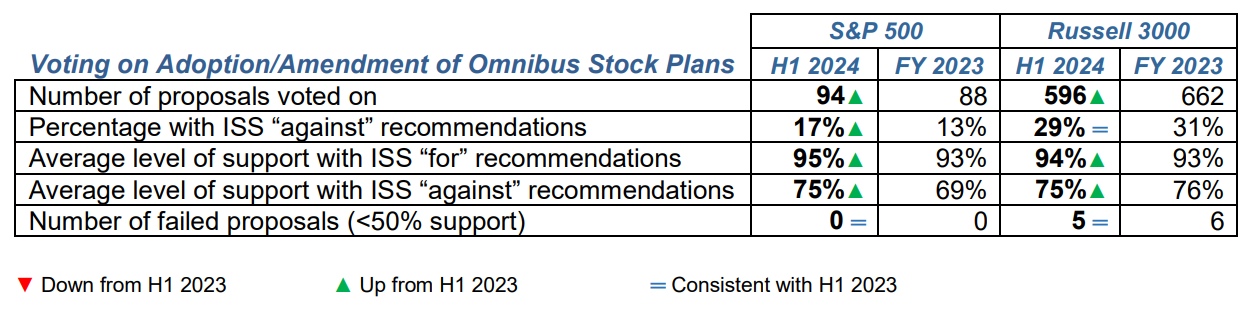
ISS recommended against approximately 29% of equity plan proposals in the case of Russell 3000 companies in H1 2024 (same as H1 2023), but recommended against only 17% in the case of S&P 500 companies (vs. 10% in H1 2023). For several of these S&P 500 companies, ISS cited broad discretionary accelerated vesting authority, excessive plan cost, excessive burn rate and liberal share recycling among the reasons for its negative recommendation. Despite the negative recommendations, all of the proposals at S&P 500 companies (and all but five proposals at Russell 3000 companies) received majority support. [17]
Even though ISS recommendations did not seem to impact pass rates, they continued to have a fairly significant impact on voting results. In H1 2024, the average support level for equity plan proposals at S&P 500 companies was 95% when ISS recommended “for” approval and 75% when ISS recommended “against” (vs. 93% and 70% in H1 2023).
1Unless otherwise noted, we present H1 2024 and full-year 2023 data in the tables throughout this publication for completeness, although the indicative symbols used in the tables compare H1 2024 with H1 2023 data, rather than the full-year 2023 data presented. In addition, in the discussion, we generally assess year-over-year changes by comparing H1 2024 and H1 2023 data for consistency.(go back)
2If a company receives less than 70% shareholder support for its say-on-pay vote, ISS will conduct a qualitative review of the compensation committee’s responsiveness to shareholder opposition at the next annual meeting, which could lead to negative recommendations against the members of the compensation committee.(go back)
3The numbers for the categories add up to more than the total because some companies received “high” concern in more than one category.(go back)
4Glass Lewis’s executive compensation assessment policy appears to be less formulaic than ISS’s, though Glass Lewis publicly discloses fewer details on its policy than does ISS. Based on Glass Lewis’s published information, it evaluates compensation based on five factors: overall compensation design and structure, implementation and effectiveness of compensation programs, disclosure of executive compensation policies and procedures, amounts paid to executives, and the link between pay and performance. In evaluating pay-for-performance, Glass Lewis looks at the compensation of the top five executive officers, not just the CEO. In addition, Glass Lewis looks at performance measures other than total shareholder return—it measures performance based on a variety of financial measures and industry-specific performance indicators.(go back)
5ISS policies emphasize the importance of clear communication with shareholders on compensation issues, particularly for companies that receive low support for say-on-pay proposals. See ISS United States Compensation Policies Frequently Asked Questions (Feb. 2, 2024), available at https://www.issgovernance.com/file/policy/active/americas/US-Compensation-Policies-FAQ.pdf (“When a say-on-pay proposal receives less than 70% support of votes cast (for and against), ISS will conduct a qualitative review of the compensation committee’s responsiveness . . . tak[ing] into consideration . . . disclosure of details on the breadth of engagement . . . [and] disclosure of specific feedback received from investors on concerns that led them to vote against the proposal.”).(go back)
6The two companies were American International Group and Amazon. ISS narratives for both companies identified perceived inadequate responses to low say-on-pay votes in prior years.(go back)
9TSR measures how much an investment in the stock would have changed over the relevant period, assuming the reinvestment of dividends.(go back)
11Of the 34 S&P 500 companies with negative ISS recommendations, ISS identified 16 as having performance standards that were not sufficiently rigorous (vs. 24 of 42 in H1 2023).(go back)
12The settlement was pending at the time Tesla’s 2024 definitive proxy statement was filed, so no shareholder vote on director compensation has yet occurred.(go back)
13The applicable state laws for such companies is Delaware (McDonald’s, eBay, UnitedHealth, VeriSign, and General Motors) and North Carolina (Lowe’s).(go back)
14This section compares data on proposals for shareholder meetings held through full-year 2023 and H1 2024.(go back)
15See Section 303A.08 of the NYSE Listed Company Manual; Nasdaq Stock Market Rule 5635.(go back)
16ISS’s current equity plan scorecard approach is described in its United States Equity Compensation Plans Frequently Asked Questions, available at https://www.issgovernance.com/file/policy/active/americas/US-Equity-Compensation-Plans-FAQ.pdf. Effective for meetings as of February 1, 2024, the passing score is 53 for all models except (i) the S&P 500 model, which has a passing score of 59, (ii) the Russell 3000 model, which has a passing score of 57 and (iii) the non-Russell 3000 model, which has a passing score of 55. Certain egregious equity plan features may result in a negative ISS recommendation, regardless of the “equity scorecard.” These egregious features include, for example, “a liberal [change-of-control] definition that could result in vesting of awards by any trigger other than a full double trigger.”(go back)
17According to ISS, proposals to adopt or amend omnibus stock plans failed to receive greater than 50% shareholder support at five Russell 3000 issuers, including three that received negative ISS recommendations—Preferred Bank (just below 50%), Applied Optoelectronics (40%) and Zevra Therapeutics (20%)—and two that ISS did not recommend against—Aurinia Pharmaceuticals (47%) and Akebia Therapeutics (46%).(go back)
Legal Disclaimer:
EIN Presswire provides this news content "as is" without warranty of any kind. We do not accept any responsibility or liability for the accuracy, content, images, videos, licenses, completeness, legality, or reliability of the information contained in this article. If you have any complaints or copyright issues related to this article, kindly contact the author above.
