Low Power Wide Area (LPWA) IoT connections to grow to 4 billion in 2030 according to Transforma Insights
Transforma Insights has further expanded its ultra-granular IoT forecasts to include assessment of the global opportunity for LPWA network technologies.
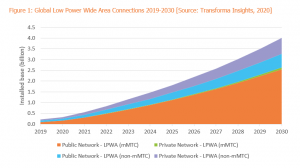
Transforma Insights today unveiled its first forecast for Low Power Wide Area (LPWA) connections for 2019 to 2030. Transforma Insights predicts 4 billion LPWA connections in 2030 (up from 220 million at the end of 2019). Almost two-thirds will be accounted for by 5G mMTC (massive Machine-Type Communications), the new terminology covering cellular LPWA technologies NB-IoT and LTE-M, which operate in licensed spectrum. The remaining one-third will be technologies such as LoRa and Sigfox that operate in licence-exempt spectrum. The mMTC devices are almost exclusively (97%) connected via public networks run by network operators. In contrast, the 1.4 billion non-mMTC LPWA devices are much more evenly split, with 46% connected via public networks and 54% by private.
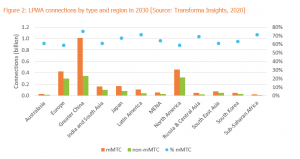
Today China is the main driving force behind global LPWA connections. At the end of 2019 it represented 57% of the global total. Over time the rest of the world catches up; by 2030 China’s share has fallen to one-third of all LPWA. Founding Partner Jim Morrish commented “China has certainly stolen a march on the rest of the world in terms of deploying IoT, particularly thanks to the aggressive network roll out of NB-IoT by the Chinese operators and some imaginative uses of the technology. But, by 2030 the rest of the world will have caught up.”
Just over half of all connections in 2030 (50.5%) are accounted for by vertical-specific applications, 29% by consumer and 20.5% by what Transforma Insights terms ‘cross-vertical’ applications which are used across multiple applications. Typically, in the case of LPWA these are generic track-and-trace type applications. Throughout the forecast period, the single biggest enterprise vertical is energy, which consistently accounts for over 20% of connections courtesy of the widespread use of the various technologies for smart metering, which is also easily the biggest application. The growth of water metering over the next decade will also see the Water vertical grow from 5% of LPWA connections today to 12% in 2030.
Join our webinar to find out more
To find out more about the Transforma Insights forecasts, join us for a webinar “Forecasting the IoT market opportunity 2019-2030” on 2nd November 2020 at 08.00 Pacific, 11.00 Eastern, 16.00 GMT, 17.00 CET.
About the Forecast
The forecasts presented here are taken from Transforma Insights’ Total Addressable Market (TAM) Forecast Database. The TAM Forecasts provide our quantitative view of the market opportunity associated with Digital Transformation and all of the associated technologies.
The IoT Connected Things forecasts presented are based on an extensive and highly granular research methodology, which involves analysing over 300 combinations of application and vertical across each of 196 countries.
The TAM Forecast Database presents forecasts from 2019 to 2030 for Revenue Generating Units (RGUs), connected devices, annual shipments and revenue across 20 use cases, 67 application groups, 20 vertical sectors and 198 countries. Device and shipment forecasts include technology splits between cellular (2G, 3G, 4G, 5G), LPWA (5G mMTC and non-mMTC), satellite, short-range and other. Revenue splits between hardware (module and non-module) and recurring (connectivity and service wrap).
About Transforma Insights
Transforma Insights is a leading research firm focused on the world of Digital Transformation (DX). Led by seasoned technology industry analysts we provide advice, recommendations and decision support tools for organisations seeking to understand how new technologies will change the markets in which they operate.
For more information about Transforma Insights, please see our website transformainsights.com or contact us at enquiries@transformainsights.com. Follow us on Twitter: @transformatweet.
Matt Hatton
Transforma Insights
+44 7787 577886
email us here
Visit us on social media:
Twitter
LinkedIn
Legal Disclaimer:
EIN Presswire provides this news content "as is" without warranty of any kind. We do not accept any responsibility or liability for the accuracy, content, images, videos, licenses, completeness, legality, or reliability of the information contained in this article. If you have any complaints or copyright issues related to this article, kindly contact the author above.


