
Mackinac Financial Corporation Reports 2020 Second Quarter Results and COVID-19 Progress
MANISTIQUE, Mich., July 30, 2020 (GLOBE NEWSWIRE) -- Mackinac Financial Corporation (Nasdaq: MFNC) (“we”, or the “Corporation”) the bank holding company for mBank (“the Bank”) today announced 2020 second quarter net income of $3.45 million, or $.33 per share, compared to 2019 second quarter net income of $3.67 million, or $.34 per share. Net income for the first two quarters of 2020 was $6.50 million, or $.61 per share, compared to $6.84 million, or $.64 per share for the same period of 2019.
Total assets of the Corporation at June 30, 2020 were $1.52 billion, compared to $1.33 billion at June 30, 2019. Shareholders’ equity at June 30, 2020 totaled $164.16 million, compared to $157.84 million at June 30, 2019. Book value per share outstanding equated to $15.58 at the end of the second quarter 2020, compared to $14.70 per share outstanding a year ago. Tangible book value at quarter-end was $139.88 million, or $13.28 per share outstanding, compared to $133.24 million, or $12.40 per share outstanding at the end of the second quarter 2019.
Additional notes:
- mBank, the Corporation’s primary asset, recorded net income of $3.88 million for the second quarter of 2020 and $7.28 million for the first six months of 2020.
- As reflected in the size of the balance sheet, the Corporation funded approximately $150 million of Payroll Protection Program (“PPP”) loans in the second quarter with origination fees totaling approximately $5.1 million. These loans are supporting over one thousand small businesses throughout our footprint with the majority of recipients residing in the Upper Peninsula and Northern Michigan.
- Only $15.3 million of commercial loan payment deferrals remain from peak levels of approximately $201 million, equating to a reduction of 92%.
- Non-interest income was very solid for the second quarter including strong secondary market mortgage fees of $1.51 million and premiums on the sale of Small Business Administration (SBA) guaranteed loans of $274 thousand. Year-to-date secondary market mortgage fees were $2.05 million and SBA premiums $984 thousand. The residential mortgage pipeline resides at very robust levels and we expect sustained output from this line of business as we look to upcoming quarters.
- Core operating margin, which is net of accretion from acquired loans that were subject to purchase accounting adjustments and PPP loan origination fees, was 3.75%. However, we also estimate, on a non-GAAP basis, that PPP loan yields (not inclusive of fee income) are roughly a 26 basis point strain. Estimated core operating margin is approximately 4.01%.
COVID-19 Operating Update
Upon the onset of the COVID-19 pandemic, management took proactive measures and moved quickly to implement protocols and adjust operations to continue to serve all constituencies. These protocols have been refined throughout the second quarter as the pandemic operating environment evolved within the Corporation’s respective regions. Speaking to these ongoing operational activities, President of the Corporation and President and CEO of mBank, Kelly W. George, stated, “When the Coronavirus crisis started to heighten around mid-March, we began to swiftly activate our pandemic response plan in each critical risk area of the bank. We subsequently closed our lobby access in the middle of March and began serving clients who needed in-person transactions almost exclusively via drive-thru windows. Most of our branch lobbies are now open to the public and all are operating under enhanced safety and cleaning protocol. Overall, the majority of our bank footprint, outside of Southeast Michigan, resides in markets where active COVID-19 cases are very nominal compared to other areas of the country. This is a trend we hope continues so that we do not need to take steps back to a more restrictive pandemic operating environment. The much lower COVID-19 case totals in most of our Northern Michigan and Wisconsin regions led to a sustained uptick in commerce activity, starting around Memorial Day, for both our tourism and retail industries. Specifically, hotel occupancies have come back to more normalized levels for this time of year. We remain cautiously optimistic that these positive health and commerce conditions can be maintained throughout our more traditionally busier seasonal months as we continue into the latter part of summer and early fall.”
Revenue & PPP Recognition
Total revenue of the Corporation for second quarter 2020 was $18.81 million, compared to $17.87 million for the second quarter of 2019. Total interest income for the second quarter was $16.44 million, compared to $16.76 million for the same period in 2019. The 2020 second quarter interest income included accretive yield of $320 thousand from combined credit mark accretion associated with acquisitions, compared to $741 thousand in the same period of 2019.
The second quarter 2020 interest income was also positively impacted by the recognition of a portion of the PPP loan origination fees that were earned during the quarter:
- The bank originated approximately $150 million of PPP loans in the second quarter.
- The origination efforts resulted in fees earned of $5.09 million, which are deferred and will be recognized over the life of the PPP loans, which is 24 months.
- Fee income of $2.13 million was recognized in the current quarter, offsetting $1.7 million of direct origination costs and the $425 thousand of accretion of the deferred fees.
- The remaining deferred fees of $2.97 million will be accreted over the remaining 21 months, or accelerated upon early payoff of the PPP loans.
Loan Production and Portfolio Mix
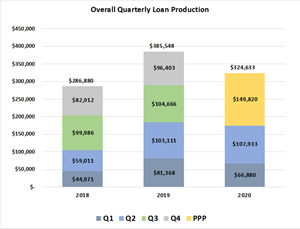
Total balance sheet loans at June 30, 2020 were $1.15 billion, which is inclusive of $149.82 million of PPP loans, compared to June 30, 2019 balances of $1.06 billion. Total loans under management reside at $1.44 billion, which includes $281.27 million of service retained loans. Driven by strong mortgage refinance activity, overall traditional loan production (non-PPP) for the first six months of 2020 was $174.81 million, compared to $184.6 million for the same period of 2019. When including PPP loans, total production was $324.63 million. Of the total production, traditional commercial loans equated to $64 million, consumer $111 million and the aforementioned $150 million of PPP. Within the consumer totals was $86 million of secondary market mortgage production. In total, 77% of PPP funds went to existing mBank clients. There were also 295 new customers that received PPP loans and 44 included a new deposit relationship.
Overall Quarterly Loan Production: https://www.globenewswire.com/NewsRoom/AttachmentNg/1b182b32-f73d-4874-84ed-4fa4f1e95cc7
New Loan Production (less PPP loans): https://www.globenewswire.com/NewsRoom/AttachmentNg/b01df5cc-99c1-40eb-9e92-3aec0898e83f
Commenting on new loan production and overall lending activities, Mr. George stated, “As can be seen from our production totals, we had a very busy second quarter, which was dominated by record mortgage production and PPP activity. The overall make up of the portfolio remains well diversified. We also continue to partake in some other specific pandemic-based relief programs that are being sponsored at the state and federal levels to help support the working capital needs of our local small businesses in terms of reopening. The relatively low number of virus cases in the majority of our footprint provide a safer environment for tourists to travel via automobile driving the strong local commerce uptick we have seen over the last several months. Our northern markets are also seeing heightened real estate activity from families and businesses looking to avoid a possible second wave of the virus and relocate for an overall healthier quality of life where working remote may become more of the norm for some time. These attributes, coupled with lack of large concentrations of inventory, have driven up prices and shortened marketing times for everything from second homes to vacant land.”
MFNC Composition of Loans June 30, 2020: https://www.globenewswire.com/NewsRoom/AttachmentNg/4c6e26ae-7e8a-4bea-a511-ca5b84062de4
Credit Quality and COVID-19 Loan Activity
Nonperforming loans totaled $6.124 million, or .53% (.61% excluding PPP balances) of total loans at June 30, 2020, compared to $6.416 million, or .61% of total loans at March 31, 2020 and $4.673 million, or .44% of total loans at June 30, 2019. Total loan delinquencies greater than 30 days resided at .54% (.61% excluding PPP balances), compared to 1.23% a quarter ago, and 1.05% in 2019. The nonperforming assets to total assets ratio resided at .55% (.61% excluding PPP balances) for the second quarter of 2020, compared to .51% for the second quarter of 2019.
COVID-19 related loan deferral activity has slowed significantly in the second quarter reducing by 90% from peak levels and equating to a nominal 2.3% of total loans. Of the original $219.60 million of payment deferred loans, $196.70 have already returned to contractual obligations of either principal and interest or interest only, for a short period, as they come off of full payment deferral to build up cash flow.
COVOD-19 Loan Modifications Still in Deferral: https://www.globenewswire.com/NewsRoom/AttachmentNg/62488d0a-feed-4513-9ee8-c5211faae69c
Of the $15.3 million of commercial loans still in payment deferral, there are no significant concentrations, with the largest single borrower categories being rental properties ($4.60 million) and Hotels ($4.00 million). Hotel specific loan deferrals have reduced significantly from $65.60 million, or a 94% reduction.
Breakdown of the $15.3M of CML COVID-19 Mods: https://www.globenewswire.com/NewsRoom/AttachmentNg/fc5fdbe6-0dab-4358-9d8d-49b9d7c22320
The second quarter provision for loan losses was $100 thousand. This amount was consistent with past quarters. As a result of COVID-19, the qualitative factors for economic conditions were adjusted within the Allowance for Loan Losses (ALLL) calculation and methodology at the end of the first quarter of 2020. These adjustments did not lead to a larger provision. Management will actively refine the provision and loan reserves as client impact and broader economic data both regionally and nationally from the pandemic becomes more clear. Coupled with the health data specific to our region and footprint that could also negatively impact the current uptick in business activity. The Corporation is not currently required to utilize CECL.
Commenting on overall credit risk, Mr. George stated, “The credit book has seen no signs of any systemic adverse trends, and the vast majority of our COVID-19 loan deferments are now expired with very few requests for extensions. While certainly not clear of all headwinds, we remain cautiously optimistic on the second half of 2020 in terms of overall credit performance given further national stimulus actions are probable and expect more clarity to evolve as to the virus spread and containment measures. Both factors helping to reduce the possibility of returning to business closures and/or a resetting of improving consumer confidence within our local markets provided a larger second wave does not materialize. Also, we remain ever vigilant in terms of monitoring deterioration in any isolated specific situations that could arise for a client or two where provisions could be needed in light of ongoing pandemic conditions within a particular industry that we all know can still change quickly.”
Margin Analysis, Funding and Liquidity
Net interest income for second quarter 2020 was $14.46 million, resulting in a Net Interest Margin (NIM) of 4.51%, compared to $14.0 million in the second quarter 2019 and a NIM of 4.76%. Core operating margin, which is net of accretion from acquired loans that were subject to purchase accounting adjustments and recognized PPP fee income, was 3.75% for the second quarter of 2020, compared to 4.43% for the same period of 2019. Items impacting margin, outside of the overall current low interest rate environment, include higher than normal cash balances as well as negative impact from the yields associated with PPP loans. On a non-GAAP basis, management currently estimates the direct negative impact of the PPP loan balances for the second quarter to be .26%. Estimated adjusted core margin for the second quarter is 4.01%.
Margin Analysis Per Quarter: https://www.globenewswire.com/NewsRoom/AttachmentNg/06b3df92-9ce7-4c7e-bb34-b3453efed0ef
Total bank deposits (excluding brokered deposits) have increased by $136.31 million year-over-year from $1.00 billion at June 30, 2019 to $1.137 billion at second quarter-end 2020. Total brokered deposits have also decreased and were $90.48 million at June 30, 2020, compared to $114.10 million at June 30, 2019, a decrease of 21%. However, brokered deposits have increased by roughly $32 million since year-end 2019. This increase is the direct result of the bank taking precautionary measures to augment its cash position at the onset of the COVID-19 pandemic and some funding of PPP loans. FHLB (Federal Home Loan Bank) borrowings were also mostly flat at $65 million since the end of 2019. The Corporation utilized the Payroll Protection Program Liquidity Facility (PPPLF) to fund a portion of the PPP loan originations. The current balance of the PPPLF is approximately $51 million. Overall access to short term functional liquidity remains very strong through multiple sources.
Mr. George stated, “We are pleased with our organic efforts in terms of core deposit growth this year within the more challenging pandemic environment. Core deposit growth just in July equates to approximately $25M supporting the commerce buildup we have seen since reopening in later May throughout our various business segments. We continue to carry large levels of liquidity in light of PPP and we also put some conservative measures in place at the onset of the pandemic to ensure funds availability given the large unknowns. These liquidity levels should continue to normalize through the rest of the year as PPP winds down and some wholesale funding sources mature. The large drop in rates in late quarter one has led to unavoidable margin compression, but we have been proactive in continuing to review and market price our deposit offerings to best offset the dollars lost.”
Noninterest Income / Expense
Second quarter 2020 noninterest income was $2.37 million, compared to $1.11 million for the same period of 2019. The significant year-over-year improvement is mainly a combination of the secondary market mortgage and SBA sales. The SBA 7A sales were not inclusive of any PPP loan fees, all of which are recognized through interest income. Noninterest Expense for the second quarter of 2020 was $12.35 million, compared to $10.26 million for the same period of 2019. For comparison purposes, noninterest expense for the first quarter of 2020 equated to $11.37 million. The quarter-over-quarter change was heavily impacted by the direct PPP expenses that were offset by corresponding PPP fee recognition as well as some pandemic related operating items. Specific non-recurring items associated with COVID-19 and PPP equated to $949 thousand and included $125 thousand of COVID-related compensation for retail centric employees, and $824 thousand of direct PPP related origination costs. Management expects expenses to normalize in the coming quarters in light of the one-time nature of these items.
Assets and Capital
Total assets of the Corporation at June 30, 2020 were $1.52 billion, compared to $1.33 billion at June 30, 2019. Shareholders’ equity at June 30, 2020 totaled $164.16 million, compared to $157.84 million at June 30, 2019. Book value per share outstanding equated to $15.58 at the end of the second quarter 2020, compared to $14.70 per share outstanding a year ago. Tangible book value at quarter end was $139.88 million, or $13.28 per share outstanding, compared to $133.24 million, or $12.40 per share outstanding at the end of the second quarter 2019.
Both the Corporation and the Bank are “well-capitalized” with total risk-based capital to risk-weighted assets of 13.79% at the Corporation and 13.30% at the Bank and tier 1 capital to total tier 1 average assets (the “leverage ratio”) at the Corporation of 9.45% and at the Bank of 8.93%. The leverage ratio is calculated inclusive of PPP loan balances. The Corporation is monitoring the impact of the recent pandemic-associated market volatility on its Goodwill asset. The Corporation continues to conduct Goodwill impairment analysis to confirm the value of this intangible asset as market events unfold.
Paul D. Tobias, Chairman and Chief Executive Officer of the Corporation and Chairman of mBank concluded, “We have weathered this economic storm thus far in a manner that has allowed us to protect our shareholders’ investment by growing our capital base and controlling our credit risk. While management acknowledges that, more likely than not, there will be challenges ahead for all banks, we can only get through the whole pandemic if we first get through the initial 120 days. We are the same bank currently as we were going into this and continue to be well-capitalized, appropriately conservative and have plenty of liquidity. Our commitment is to continue with our steadfast efforts to help our employees, customers and communities through this crisis while managing the bank for continued success. It is at times like this where the value of a community bank is demonstrated in the marketplace through the customers that we have helped.”
Mackinac Financial Corporation is a registered bank holding company formed under the Bank Holding Company Act of 1956 with assets in excess of $1.5 billion and whose common stock is traded on the NASDAQ stock market as “MFNC.” The principal subsidiary of the Corporation is mBank. Headquartered in Manistique, Michigan, mBank has 29 branch locations; eleven in the Upper Peninsula, ten in the Northern Lower Peninsula, one in Oakland County, Michigan, and seven in Northern Wisconsin. The Corporation’s banking services include commercial lending and treasury management products and services geared toward small to mid-sized businesses, as well as a full array of personal and business deposit products and consumer loans.
Forward-Looking Statements
This release contains certain forward-looking statements. Words such as “anticipates,” “believes,” “estimates,” “expects,” “intends,” “should,” “will,” and variations of such words and similar expressions are intended to identify forward-looking statements: as defined by the Private Securities Litigation Reform Act of 1995. These statements reflect management’s current beliefs as to expected outcomes of future events and are not guarantees of future performance. These statements involve certain risks, uncertainties and assumptions that are difficult to predict with regard to timing, extent, likelihood, and degree of occurrence. Therefore, actual results and outcomes may materially differ from what may be expressed or forecasted in such forward-looking statements. Factors that could cause a difference include among others: the effects of the COVID-19 pandemic, particularly potentially negative effects on our customers, borrowers, third party service providers and our liquidity; changes in the national and local economies or market conditions; changes in interest rates and banking regulations; the impact of competition from traditional or new sources; and the possibility that anticipated cost savings and revenue enhancements from mergers and acquisitions, bank consolidations, and other sources may not be fully realized at all or within specified time frames as well as other risks and uncertainties including but not limited to those detailed from time to time in filings of the Corporation with the Securities and Exchange Commission. These and other factors may cause decisions and actual results to differ materially from current expectations. Mackinac Financial Corporation undertakes no obligation to revise, update, or clarify forward-looking statements to reflect events or conditions after the date of this release.
Contact: Jesse A. Deering, EVP & Chief Financial Officer (248) 290-5906 / jdeering@bankmbank.com
Website: www.bankmbank.com
MACKINAC FINANCIAL CORPORATION AND SUBSIDIARIES
SELECTED FINANCIAL HIGHLIGHTS
| As of and For the | As of and For the | As of and For the | |||||||
| Period Ending | Year Ending | Period Ending | |||||||
| June 30, | December 31, | June 30, | |||||||
| (Dollars in thousands, except per share data) | 2020 | 2019 | 2019 | ||||||
| (Unaudited) | (Unaudited) | ||||||||
| Selected Financial Condition Data (at end of period): | |||||||||
| Assets | $ | 1,518,473 | $ | 1,320,069 | $ | 1,330,723 | |||
| Loans | 1,153,790 | 1,058,776 | 1,060,703 | ||||||
| Investment securities | 108,703 | 107,972 | 110,348 | ||||||
| Deposits | 1,227,552 | 1,075,677 | 1,114,853 | ||||||
| Borrowings | 114,466 | 64,551 | 46,232 | ||||||
| Shareholders' equity | 164,157 | 161,919 | 157,840 | ||||||
| Selected Statements of Income Data (six months and year ended) | |||||||||
| Net interest income | $ | 27,855 | $ | 53,907 | $ | 27,233 | |||
| Income before taxes | 8,235 | 17,710 | 8,653 | ||||||
| Net income | 6,505 | 13,850 | 6,836 | ||||||
| Income per common share - Basic | .61 | 1.29 | .64 | ||||||
| Income per common share - Diluted | .61 | 1.29 | .64 | ||||||
| Weighted average shares outstanding - Basic | 10,625,778 | 10,737,653 | 10,730,477 | ||||||
| Weighted average shares outstanding- Diluted | 10,552,581 | 10,757,507 | 10,739,471 | ||||||
| Three Months Ended: | |||||||||
| Net interest income | $ | 14,458 | $ | 13,350 | $ | 13,997 | |||
| Income before taxes | 4,373 | 4,350 | 4,644 | ||||||
| Net income | 3,454 | 3,296 | 3,669 | ||||||
| Income per common share - Basic | .33 | .31 | .34 | ||||||
| Income per common share - Diluted | .33 | .31 | .34 | ||||||
| Weighted average shares outstanding - Basic | 10,533,589 | 10,748,712 | 10,740,712 | ||||||
| Weighted average shares outstanding- Diluted | 10,460,802 | 10,768,841 | 10,752,070 | ||||||
| Selected Financial Ratios and Other Data: | |||||||||
| Performance Ratios: | |||||||||
| Net interest margin | 4.55 | % | 4.57 | % | 4.65 | % | |||
| Efficiency ratio | 73.23 | 69.10 | 68.94 | ||||||
| Return on average assets | .93 | 1.04 | 1.04 | ||||||
| Return on average equity | 8.05 | 8.78 | 8.89 | ||||||
| Average total assets | $ | 1,411,081 | $ | 1,332,882 | $ | 1,323,321 | |||
| Average total shareholders' equity | 162,556 | 157,831 | 155,098 | ||||||
| Average loans to average deposits ratio | 95.91 | % | 95.03 | % | 95.22 | % | |||
| Common Share Data at end of period: | |||||||||
| Market price per common share | $ | 10.37 | $ | 17.56 | $ | 15.80 | |||
| Book value per common share | 15.58 | 15.06 | 14.70 | ||||||
| Tangible book value per share | 13.28 | 12.77 | 12.40 | ||||||
| Dividends paid per share, annualized | .560 | .520 | .480 | ||||||
| Common shares outstanding | 10,533,589 | 10,748,712 | 10,740,712 | ||||||
| Other Data at end of period: | |||||||||
| Allowance for loan losses | $ | 5,355 | $ | 5,308 | $ | 5,306 | |||
| Non-performing assets | $ | 8,350 | $ | 7,377 | $ | 6,798 | |||
| Allowance for loan losses to total loans | .53 | % | .49 | % | .50 | % | |||
| Non-performing assets to total assets | .55 | % | .56 | % | .51 | % | |||
| Texas ratio | 4.22 | % | 4.41 | % | 4.91 | % | |||
| Number of: | |||||||||
| Branch locations | 29 | 29 | 29 | ||||||
| FTE Employees | 315 | 304 | 301 | ||||||
MACKINAC FINANCIAL CORPORATION AND SUBSIDIARIES
CONSOLIDATED BALANCE SHEETS
| June 30, | December 31, | June 30, | |||||||||
| 2020 | 2019 | 2019 | |||||||||
| (Unaudited) | (Unaudited) | ||||||||||
| ASSETS | |||||||||||
| Cash and due from banks | $ | 126,398 | $ | 49,794 | $ | 60,680 | |||||
| Federal funds sold | 28,110 | 32 | 10 | ||||||||
| Cash and cash equivalents | 154,508 | 49,826 | 60,690 | ||||||||
| Interest-bearing deposits in other financial institutions | 7,831 | 10,295 | 12,465 | ||||||||
| Securities available for sale | 108,703 | 107,972 | 110,348 | ||||||||
| Federal Home Loan Bank stock | 4,924 | 4,924 | 4,924 | ||||||||
| Loans: | |||||||||||
| Commercial | 878,521 | 765,524 | 755,176 | ||||||||
| Mortgage | 255,524 | 272,014 | 284,864 | ||||||||
| Consumer | 19,745 | 21,238 | 20,663 | ||||||||
| Total Loans | 1,153,790 | 1,058,776 | 1,060,703 | ||||||||
| Allowance for loan losses | (5,355 | ) | (5,308 | ) | (5,306 | ) | |||||
| Net loans | 1,148,435 | 1,053,468 | 1,055,397 | ||||||||
| Premises and equipment | 25,448 | 23,608 | 23,166 | ||||||||
| Other real estate held for sale | 2,226 | 2,194 | 2,125 | ||||||||
| Deferred tax asset | 1,727 | 3,732 | 4,609 | ||||||||
| Deposit based intangibles | 4,706 | 5,043 | 5,380 | ||||||||
| Goodwill | 19,574 | 19,574 | 19,574 | ||||||||
| Other assets | 40,391 | 39,433 | 32,045 | ||||||||
| TOTAL ASSETS | $ | 1,518,473 | $ | 1,320,069 | $ | 1,330,723 | |||||
| LIABILITIES AND SHAREHOLDERS’ EQUITY | |||||||||||
| LIABILITIES: | |||||||||||
| Deposits: | |||||||||||
| Noninterest bearing deposits | $ | 385,811 | $ | 287,611 | $ | 276,776 | |||||
| NOW, money market, interest checking | 386,029 | 373,165 | 344,213 | ||||||||
| Savings | 123,771 | 109,548 | 111,438 | ||||||||
| CDs<$250,000 | 226,971 | 233,956 | 256,689 | ||||||||
| CDs>$250,000 | 14,488 | 12,775 | 11,640 | ||||||||
| Brokered | 90,482 | 58,622 | 114,097 | ||||||||
| Total deposits | 1,227,552 | 1,075,677 | 1,114,853 | ||||||||
| Federal funds purchased | — | 6,225 | — | ||||||||
| Borrowings | 114,466 | 64,551 | 46,232 | ||||||||
| Other liabilities | 12,298 | 11,697 | 11,798 | ||||||||
| Total liabilities | 1,354,316 | 1,158,150 | 1,172,883 | ||||||||
| SHAREHOLDERS’ EQUITY: | |||||||||||
| Common stock and additional paid in capital - No par value Authorized - 18,000,000 shares Issued and outstanding - 10,533,589; 10,748,712 and 10,740,712 respectively | 127,213 | 129,564 | 129,262 | ||||||||
| Retained earnings | 35,295 | 31,740 | 27,734 | ||||||||
| Accumulated other comprehensive income (loss) | |||||||||||
| Unrealized (losses) gains on available for sale securities | 2,059 | 1,025 | 1,062 | ||||||||
| Minimum pension liability | (410 | ) | (410 | ) | (218 | ) | |||||
| Total shareholders’ equity | 164,157 | 161,919 | 157,840 | ||||||||
| TOTAL LIABILITIES AND SHAREHOLDERS’ EQUITY | $ | 1,518,473 | $ | 1,320,069 | $ | 1,330,723 | |||||
MACKINAC FINANCIAL CORPORATION AND SUBSIDIARIES
CONSOLIDATED STATEMENTS OF OPERATIONS
| For the Three Months Ended | For the Six Months Ended | ||||||||||
| June 30, | June 30, | ||||||||||
| 2020 | 2019 | 2020 | 2019 | ||||||||
| (Unaudited) | (Unaudited) | ||||||||||
| INTEREST INCOME: | |||||||||||
| Interest and fees on loans: | |||||||||||
| Taxable | $ | 15,549 | $ | 15,586 | $ | 30,162 | $ | 30,181 | |||
| Tax-exempt | 55 | 42 | 129 | 89 | |||||||
| Interest on securities: | |||||||||||
| Taxable | 560 | 680 | 1,180 | 1,383 | |||||||
| Tax-exempt | 152 | 85 | 240 | 183 | |||||||
| Other interest income | 125 | 367 | 395 | 752 | |||||||
| Total interest income | 16,441 | 16,760 | 32,106 | 32,588 | |||||||
| INTEREST EXPENSE: | |||||||||||
| Deposits | 1,707 | 2,515 | 3,634 | 4,869 | |||||||
| Borrowings | 276 | 248 | 617 | 486 | |||||||
| Total interest expense | 1,983 | 2,763 | 4,251 | 5,355 | |||||||
| Net interest income | 14,458 | 13,997 | 27,855 | 27,233 | |||||||
| Provision for loan losses | 100 | 200 | 200 | 300 | |||||||
| Net interest income after provision for loan losses | 14,358 | 13,797 | 27,655 | 26,933 | |||||||
| OTHER INCOME: | |||||||||||
| Deposit service fees | 236 | 408 | 640 | 814 | |||||||
| Income from loans sold on the secondary market | 1,511 | 355 | 2,049 | 667 | |||||||
| SBA/USDA loan sale gains | 274 | 29 | 984 | 154 | |||||||
| Mortgage servicing amortization | 204 | 128 | 393 | 248 | |||||||
| Other | 142 | 190 | 238 | 344 | |||||||
| Total other income | 2,367 | 1,110 | 4,304 | 2,227 | |||||||
| OTHER EXPENSE: | |||||||||||
| Salaries and employee benefits | 7,009 | 5,511 | 13,060 | 10,946 | |||||||
| Occupancy | 1,008 | 1,004 | 2,132 | 2,085 | |||||||
| Furniture and equipment | 804 | 723 | 1,606 | 1,441 | |||||||
| Data processing | 852 | 708 | 1,677 | 1,417 | |||||||
| Advertising | 312 | 214 | 524 | 523 | |||||||
| Professional service fees | 574 | 547 | 1,072 | 981 | |||||||
| Loan origination expenses and deposit and card related fees | 406 | 184 | 787 | 363 | |||||||
| Writedowns and losses on other real estate held for sale | 30 | 73 | 34 | 101 | |||||||
| FDIC insurance assessment | 165 | 77 | 315 | 211 | |||||||
| Communications expense | 224 | 232 | 437 | 460 | |||||||
| Other | 968 | 990 | 2,080 | 1,979 | |||||||
| Total other expenses | 12,352 | 10,263 | 23,724 | 20,507 | |||||||
| Income before provision for income taxes | 4,373 | 4,644 | 8,235 | 8,653 | |||||||
| Provision for income taxes | 919 | 975 | 1,730 | 1,817 | |||||||
| NET INCOME AVAILABLE TO COMMON SHAREHOLDERS | $ | 3,454 | $ | 3,669 | $ | 6,505 | $ | 6,836 | |||
| INCOME PER COMMON SHARE: | |||||||||||
| Basic | $ .33 | $ .34 | $ .61 | $ .64 | |||||||
| Diluted | $ .33 | $ .34 | $ .61 | $ .64 | |||||||
MACKINAC FINANCIAL CORPORATION AND SUBSIDIARIES
LOAN PORTFOLIO AND CREDIT QUALITY
| (Dollars in thousands) | ||||||||
| Loan Portfolio Balances (at end of period): | ||||||||
| June 30, | December 31, | June 30, | ||||||
| 2020 | 2019 | 2019 | ||||||
| (Unaudited) | (Audited) | (Unaudited) | ||||||
| Commercial Loans: | ||||||||
| Real estate - operators of nonresidential buildings | $ | 136,299 | $ | 141,965 | $ | 143,897 | ||
| Hospitality and tourism | 98,981 | 97,721 | 92,809 | |||||
| Lessors of residential buildings | 48,852 | 51,085 | 49,489 | |||||
| Gasoline stations and convenience stores | 28,463 | 27,176 | 26,974 | |||||
| Logging | 22,283 | 22,136 | 21,666 | |||||
| Commercial construction | 38,712 | 40,107 | 36,803 | |||||
| Other | 504,931 | 385,334 | 383,538 | |||||
| Total Commercial Loans | 878,521 | 765,524 | 755,176 | |||||
| 1-4 family residential real estate | 235,467 | 253,918 | 273,813 | |||||
| Consumer | 19,745 | 21,238 | 20,663 | |||||
| Consumer construction | 20,057 | 18,096 | 11,051 | |||||
| Total Loans | $ | 1,153,790 | $ | 1,058,776 | $ | 1,060,703 | ||
Credit Quality (at end of period):
| June 30, | December 31, | June 30, | |||||||
| 2020 | 2019 | 2019 | |||||||
| (Unaudited) | (Audited) | (Unaudited) | |||||||
| Nonperforming Assets : | |||||||||
| Nonaccrual loans | $ | 6,124 | $ | 5,172 | $ | 4,673 | |||
| Loans past due 90 days or more | - | 11 | - | ||||||
| Restructured loans | - | - | - | ||||||
| Total nonperforming loans | 6,124 | 5,183 | 4,673 | ||||||
| Other real estate owned | 2,226 | 2,194 | 2,125 | ||||||
| Total nonperforming assets | $ | 8,350 | $ | 7,377 | $ | 6,798 | |||
| Nonperforming loans as a % of loans | .53 | % | .49 | % | .44 | % | |||
| Nonperforming assets as a % of assets | .55 | % | .56 | % | .51 | % | |||
| Reserve for Loan Losses: | |||||||||
| At period end | $ | 5,355 | $ | 5,308 | $ | 5,306 | |||
| As a % of outstanding loans | .46 | % | .50 | % | .50 | % | |||
| As a % of nonperforming loans | 87.44 | % | 102.41 | % | 113.55 | % | |||
| As a % of nonaccrual loans | 87.44 | % | 102.63 | % | 113.55 | % | |||
| Texas Ratio | 4.22 | % | 4.41 | % | 4.91 | % | |||
| Charge-off Information (year to date): | |||||||||
| Average loans | $ | 1,097,382 | $ | 1,047,439 | $ | 1,049,383 | |||
| Net charge-offs (recoveries) | $ | 153 | $ | 260 | $ | 177 | |||
| Charge-offs as a % of average | |||||||||
| loans, annualized | .03 | % | .02 | % | .03 | % | |||
MACKINAC FINANCIAL CORPORATION AND SUBSIDIARIES QUARTERLY FINANCIAL HIGHLIGHTS
| QUARTER ENDED | |||||||||||||||||||
| (Unaudited) | |||||||||||||||||||
| June 30, | March 31, | December 31, | September 30, | June 30, | |||||||||||||||
| 2020 | 2020 | 2019 | 2019 | 2019 | |||||||||||||||
| BALANCE SHEET (Dollars in thousands) | |||||||||||||||||||
| Total loans | $ | 1,153,790 | $ | 1,044,177 | $ | 1,058,776 | $ | 1,059,942 | $ | 1,060,703 | |||||||||
| Allowance for loan losses | (5,355 | ) | (5,292 | ) | (5,308 | ) | (5,308 | ) | (5,306 | ) | |||||||||
| Total loans, net | 1,148,435 | 1,038,885 | 1,053,468 | 1,054,634 | 1,055,397 | ||||||||||||||
| Total assets | 1,518,473 | 1,356,381 | 1,320,069 | 1,355,383 | 1,330,723 | ||||||||||||||
| Core deposits | 1,122,582 | 984,936 | 1,004,280 | 1,022,115 | 989,116 | ||||||||||||||
| Noncore deposits | 104,970 | 110,445 | 71,397 | 91,464 | 125,737 | ||||||||||||||
| Total deposits | 1,227,552 | 1,095,381 | 1,075,677 | 1,113,579 | 1,114,853 | ||||||||||||||
| Total borrowings | 114,466 | 67,120 | 64,551 | 70,079 | 46,232 | ||||||||||||||
| Total shareholders' equity | 164,157 | 160,060 | 161,919 | 160,165 | 157,840 | ||||||||||||||
| Total tangible equity | 139,877 | 135,612 | 137,302 | 135,379 | 133,236 | ||||||||||||||
| Total shares outstanding | 10,533,589 | 10,533,589 | 10,748,712 | 10,740,712 | 10,740,712 | ||||||||||||||
| Weighted average shares outstanding | 10,533,589 | 10,717,967 | 10,748,712 | 10,740,712 | 10,740,712 | ||||||||||||||
| AVERAGE BALANCES (Dollars in thousands) | |||||||||||||||||||
| Assets | $ | 1,501,423 | $ | 1,321,134 | $ | 1,347,916 | $ | 1,354,220 | $ | 1,326,827 | |||||||||
| Earning assets | 1,290,012 | 1,171,551 | 1,205,241 | 1,204,782 | 1,179,584 | ||||||||||||||
| Loans | 1,147,620 | 1,047,144 | 1,081,294 | 1,065,337 | 1,051,998 | ||||||||||||||
| Noninterest bearing deposits | 346,180 | 284,677 | 283,259 | 284,354 | 260,441 | ||||||||||||||
| Deposits | 1,211,694 | 1,076,206 | 1,080,359 | 1,124,433 | 1,103,413 | ||||||||||||||
| Equity | 161,811 | 162,661 | 161,588 | 159,453 | 156,491 | ||||||||||||||
| INCOME STATEMENT (Dollars in thousands) | |||||||||||||||||||
| Net interest income | $ | 14,458 | $ | 13,397 | $ | 13,350 | $ | 13,324 | $ | 13,997 | |||||||||
| Provision for loan losses | 100 | 100 | 35 | 50 | 200 | ||||||||||||||
| Net interest income after provision | 14,358 | 13,297 | 13,315 | 13,274 | 13,797 | ||||||||||||||
| Total noninterest income | 2,367 | 1,937 | 1,848 | 1,878 | 1,110 | ||||||||||||||
| Total noninterest expense | 12,352 | 11,372 | 10,813 | 10,444 | 10,263 | ||||||||||||||
| Income before taxes | 4,373 | 3,862 | 4,350 | 4,708 | 4,644 | ||||||||||||||
| Provision for income taxes | 919 | 811 | 1,054 | 989 | 975 | ||||||||||||||
| Net income available to common shareholders | $ | 3,454 | $ | 3,051 | $ | 3,296 | $ | 3,719 | $ | 3,669 | |||||||||
| Income pre-tax, pre-provision | $ | 4,473 | $ | 3,962 | $ | 4,385 | $ | 4,758 | $ | 4,844 | |||||||||
| PER SHARE DATA | |||||||||||||||||||
| Earnings per common share | $ | .33 | $ | .28 | $ | .31 | $ | .35 | $ | .34 | |||||||||
| Book value per common share | 15.58 | 15.20 | 15.06 | 14.91 | 14.70 | ||||||||||||||
| Tangible book value per share | 13.28 | 12.87 | 12.77 | 12.60 | 12.40 | ||||||||||||||
| Market value, closing price | 10.37 | 10.45 | 17.56 | 15.46 | 15.80 | ||||||||||||||
| Dividends per share | .140 | .140 | .140 | .140 | .120 | ||||||||||||||
| ASSET QUALITY RATIOS | |||||||||||||||||||
| Nonperforming loans/total loans | .53 | % | .61 | % | .49 | % | .46 | % | .44 | % | |||||||||
| Nonperforming assets/total assets | .55 | .64 | .56 | .55 | .51 | ||||||||||||||
| Allowance for loan losses/total loans | .46 | .51 | .50 | .50 | .50 | ||||||||||||||
| Allowance for loan losses/nonperforming loans | 87.44 | 82.48 | 102.41 | 109.33 | 113.55 | ||||||||||||||
| Texas ratio | 4.22 | 6.13 | 4.41 | 5.31 | 4.91 | ||||||||||||||
| PROFITABILITY RATIOS | |||||||||||||||||||
| Return on average assets | .93 | % | .93 | % | .97 | % | 1.09 | % | 1.11 | % | |||||||||
| Return on average equity | 8.58 | 7.54 | 8.09 | 9.25 | 9.40 | ||||||||||||||
| Net interest margin | 4.51 | 4.60 | 4.39 | 4.39 | 4.76 | ||||||||||||||
| Average loans/average deposits | 94.71 | 97.30 | 100.09 | 94.74 | 95.34 | ||||||||||||||
| CAPITAL ADEQUACY RATIOS | |||||||||||||||||||
| Tier 1 leverage ratio | 9.45 | % | 10.20 | % | 10.09 | % | 9.81 | % | 9.74 | % | |||||||||
| Tier 1 capital to risk weighted assets | 13.27 | 12.89 | 12.71 | 12.39 | 12.20 | ||||||||||||||
| Total capital to risk weighted assets | 13.79 | 13.41 | 13.22 | 12.90 | 12.72 | ||||||||||||||
| Average equity/average assets (for the quarter) | 10.78 | 12.31 | 11.99 | 11.77 | 11.80 | ||||||||||||||

Overall Quarterly Loan Production
Overall Quarterly Loan Production
New Loan Production (less PPP loans)

New Loan Production (less PPP loans)
MFNC Composition of Loans June 30, 2020

MFNC Composition of Loans June 30, 2020
COVID-19 Loan Modifications Still in Deferral

COVID-19 Loan Modifications Still in Deferral
Breakdown of the $15.3M of CML COVID-19 Mods

Breakdown of the $15.3M of CML COVID-19 Mods
Margin Analysis Per Quarter

Margin Analysis Per Quarter
