

Infragistics and Adaptable Tools: Bringing Unprecedented Power to the Desktop
The power has just been turned up on the financial desktop with a new partnership that provides users with an unprecedented combination of innovative charting tools and powerful DataGrid functionality.
Cranbury, NJ, March 06, 2019 (GLOBE NEWSWIRE) -- Infragistics, the leading provider of UI components, has joined forces with the Adaptable Blotter, the market-standard HTML5 DataGrid Add-on from Adaptable Tools, to offer integrated, live charting within the DataGrid, something not previously available for financial users.
The unique partnership allows effortless switching between charting and table views together with a host of other features that will enable users to view and manipulate their data in ways not previously possible.
Key features include
|
||||||
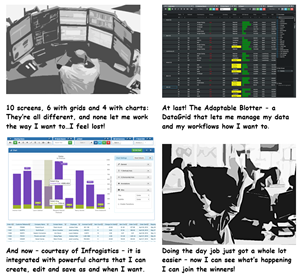
- Live Charts updating automatically as grid data ticks
- Multiple chart types – e.g. column, line, point, step, spline, waterfall and many others
- Powerful highlighting and annotation features, including Crosshairs, Tooltips and Transitions
- Callouts and Final Values so users can see their data as never before
- Saveable charts which are available when application re-starts
- One-click Team-sharing to enable easy distribution to colleagues
- Cutting-edge querying capability to show the data that really matters
- Extensive styling options allowing individual customisation of each chart
- Config options to specify where on the page the Charts should appear
Explore the Basic Chart demo or World Stats Chart demo and see the magic for yourself, or watch CTO Jonny Wolfson walk users through the new features.
This initial release will be followed over the next six months by additional enhancements, including pie charts, doughnut charts, financial charts, data series charts and a cutting-edge Excel DataGrid library.
Barry Gould, Financial Services Industry Expert said:
This is a real game-changer in terms of what is available on the financial desktop. It can offer a strategic advantage to help visualise and then be able to quickly spot data patterns that can help make critical decisions in a very competitive financial market.
Jason Beres, Senior VP Development Tools at Infragistics said:
We are excited to partner with Adaptable Tools as they bring new capabilities to the market with their flagship Adaptable Blotter product. With the integration of Infragistics Data Visualization Charting UI, Adaptable can offer their financial services customers new capabilities in data analysis and reporting with our feature rich, high-volume, real-time charting engine.
We look forward to a strong partnership with Adaptable Tools in the coming years as we both strengthen our product offering to deliver our capability and productivity to our customers.
Danielle Nagler, CEO of Adaptable Tools, said:
We are delighted to bring together the expertise at Infragistics and Adaptable Tools to deliver the enhancements to the financial desktop that our users have been waiting for. Both companies are fully committed to working together to make financial systems work better for those who depend on them.
###
Infragistics is a worldwide leader in providing tools and solutions to accelerate application design and development, insights and collaboration for any organization. More than two million developers use Infragistics enterprise-ready UX and UI toolkits to rapidly prototype and build high-performing applications for the Cloud, Web, Windows, iOS and Android devices. Infragistics Enterprise Mobility solutions ReportPlus and SharePlus, give business users the latest advancements in self-service business intelligence and collaboration software. Additionally, Infragistics offers expert UX Services and award-winning support.
Adaptable Tools is an award-winning FinTech start-up based in London and Tel Aviv focused on delivering innovative, data management tools which are designed to put the power back in the hands of their users. Its flagship product, the Adaptable Blotter, is the most powerful and feature-rich HTML5 DataGrid solution available on the market and is used by many of the world’s leading financial institutions to enhance user productivity and standardise their User Interface.
Attachment
Summer Tran
Infragistics
(609) 448-2000
stran@infragistics.com
Legal Disclaimer:
EIN Presswire provides this news content "as is" without warranty of any kind. We do not accept any responsibility or liability for the accuracy, content, images, videos, licenses, completeness, legality, or reliability of the information contained in this article. If you have any complaints or copyright issues related to this article, kindly contact the author above.
