
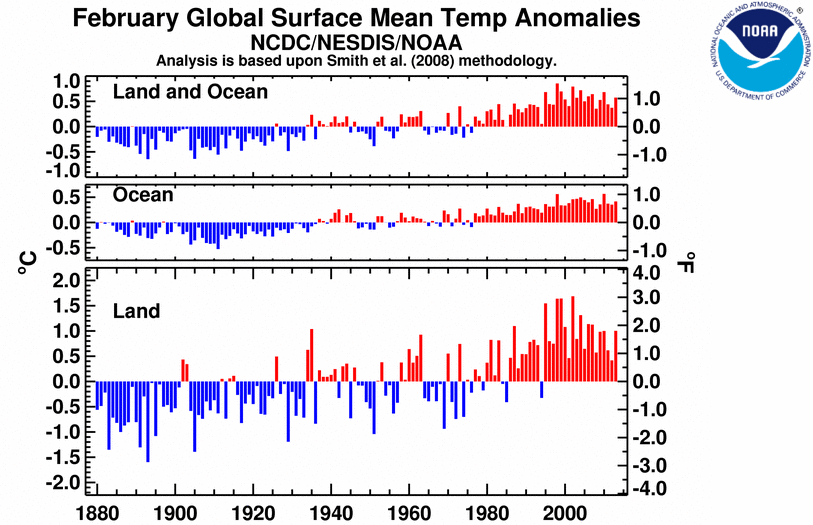
Global February temperatures were ninth highest on record
 February 2013 Blended Land and Sea Surface
Temperature Percentiles
February 2013 Blended Land and Sea Surface
Temperature Percentiles
The February 2013 globally-averaged temperature across land and ocean surfaces was 0.57°C (1.03°F) above the 20th century average of 12.1°C (53.8°F), tying with 2003 as the ninth warmest February since records began in 1880 and the warmest February since 2010, a period during which El Niño was present in the eastern equatorial Pacific Ocean.
The global land surface temperature anomaly was 1.00°C (1.80°F) higher than average, tying with 2010 as the 11th warmest on record for the month of February. Following two months of record-warm monthly temperatures, the Southern Hemisphere land ranked as the 7th warmest on record for February, at 0.90°C (1.62°F) above the long-term average. The Northern Hemisphere land ranked as the 13th warmest February (1.04°C / 1.87°F above average), compared with December 2012 and January 2013, which ranked as 70th and 21st warmest, respectively.
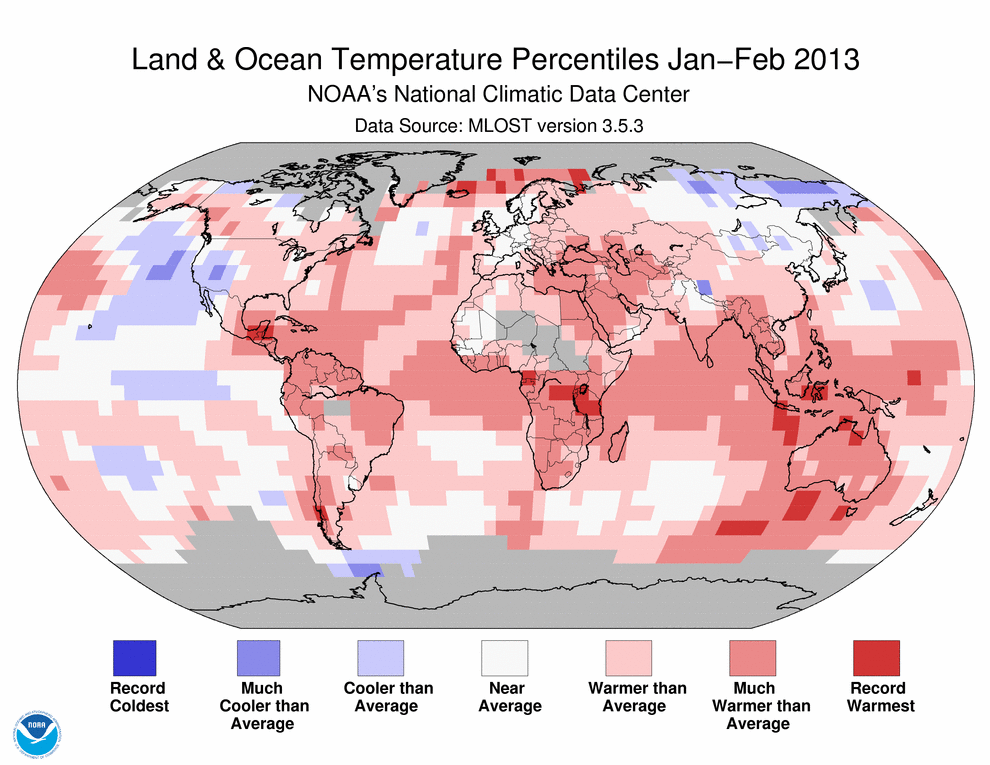
It was much warmer than average across much of Mexico, Central America, northern South America, parts of Africa, the Middle East, and Southeast Asia. It was cooler than average across the southwestern United States, part of western Europe, Mongolia, and eastern Siberia, where some regions experienced record cold.
Select national information is highlighted below:- In the high northern latitudes, Iceland was "exceptionally warm" for February, according to the Icelandic Meteorological Office. The capital city of Reykjavic was third warmest for February in its 143-year period of record.
- Finland was milder than average during February. The Finnish Meteorological Institute reported temperature anomalies that ranged from about +1°C to +2°C (+1.8°F to +2°F) in Enontekiö and far northern Lapland to about +5°C (+9°F) in far eastern Finland.
- Austria was 1.0°C (1.8°F) below the 1981–2010 average. Areas in the Alps were up to 4.1°C (7.4°F) colder than average.
- Spain was 0.9°C (1.6°F) below the 1971–2000 average during February. Temperatures were 1– 2°C (1.8°3.6–3.6°F) below average across nearly half of the country. Only a small area in far east central Spain was slightly above average for the month.
- Following its all-time record-warmest month in January, the February average maximum and minimum temperatures across Australia remained above the 1961–1990 average, though not as extreme as the previous month, ranking as the 16th and 35th warmest for February, respectively.
The February 2013 globally-averaged ocean temperature anomaly of 0.57°C (1.03°F) was the eighth warmest on record for February. ENSO-neutral conditions were present across the central and eastern equatorial Pacific Ocean, with sea surface temperatures below average across the eastern half of the equatorial Pacific. According to NOAA's Climate Prediction Center, neutral conditions are favored into the Northern Hemisphere summer 2013. In other regions, it was notably warmer than average across the equatorial Atlantic, Indian, and western Pacific Oceans, with record warmth observed in the Indian Ocean near parts of northern and southwestern Australia, the seas of Borneo to New Guinea, and some areas of the Arctic Seas. Associated with a persistent negative phase of the Pacific Decadal Oscillation, temperatures were cooler than average across the northeastern Pacific Ocean. Images of sea surface temperature conditions are available for all weeks during 2013 from the weekly SST page.
| February | Anomaly | Rank (out of 134 years) | Records | ||||
|---|---|---|---|---|---|---|---|
| °C | °F | Year(s) | °C | °F | |||
| Global | |||||||
| Land | +1.00 ± 0.32 | +1.80 ± 0.58 | Warmest | 11th | 2002 | +1.69 | +3.04 |
| Coolest | 124th | 1893 | -1.60 | -2.88 | |||
| Ties: 2010 | |||||||
| Ocean | +0.42 ± 0.04 | +0.76 ± 0.07 | Warmest | 8th | 2010 | +0.57 | +1.03 |
| Coolest | 127th | 1911 | -0.53 | -0.95 | |||
| Land and Ocean | +0.57 ± 0.12 | +1.03 ± 0.22 | Warmest | 9th | 1998 | +0.86 | +1.55 |
| Coolest | 126th | 1893, 1905 | -0.64 | -1.15 | |||
| Ties: 2003 | |||||||
| Northern Hemisphere | |||||||
| Land | +1.04 ± 0.33 | +1.87 ± 0.59 | Warmest | 13th | 2002 | +2.26 | +4.07 |
| Coolest | 122nd | 1893 | -1.92 | -3.46 | |||
| Ties: 1934 | |||||||
| Ocean | +0.38 ± 0.04 | +0.68 ± 0.07 | Warmest | 7th | 2010 | +0.56 | +1.01 |
| Coolest | 128th | 1904, 1911 | -0.47 | -0.85 | |||
| Ties: 2003 | |||||||
| Land and Ocean | +0.63 ± 0.17 | +1.13 ± 0.31 | Warmest | 10th | 2002 | +1.10 | +1.98 |
| Coolest | 125th | 1893 | -0.95 | -1.71 | |||
| Southern Hemisphere | |||||||
| Land | +0.90 ± 0.12 | +1.62 ± 0.22 | Warmest | 7th | 2010 | +1.19 | +2.14 |
| Coolest | 128th | 1917 | -1.06 | -1.91 | |||
| Ocean | +0.45 ± 0.05 | +0.81 ± 0.09 | Warmest | 10th | 1998 | +0.59 | +1.06 |
| Coolest | 125th | 1911 | -0.56 | -1.01 | |||
| Ties: 2006 | |||||||
| Land and Ocean | +0.52 ± 0.07 | +0.94 ± 0.13 | Warmest | 8th | 2010 | +0.67 | +1.21 |
| Coolest | 127th | 1911 | -0.58 | -1.04 | |||
Seasonal (December–February)
 December 2012–February 2013 Blended Land and Sea Surface
Temperature Anomalies in degrees Celsius
December 2012–February 2013 Blended Land and Sea Surface
Temperature Anomalies in degrees Celsius
 December 2012–February 2013 Blended Land and Sea Surface
Temperature Percentiles
December 2012–February 2013 Blended Land and Sea Surface
Temperature Percentiles
The December 2012–February 2013 average seasonal temperature across the world's land and ocean surfaces was 12th warmest on record for the period, at 0.51°C (0.92°F) above the 20th century average. With ENSO-neutral conditions persisting during all three months in the eastern and central equatorial Pacific Ocean, the globally-averaged ocean surface temperature was the eighth warmest for December–February, with record-warm temperatures observed across the Indian Ocean near northwestern and southwestern Australia and some areas of the Arctic Seas.
Globally, the land surface temperature tied with 1992 as the 15th warmest December–February on record. There were differences between the hemispheres, however, with the Southern Hemisphere land observing its second warmest summer on record (0.98°C / 1.76°F above average) and the Northern Hemisphere land observing its 27th warmest winter on record (0.61°C / 1.10°F above average). The majority of Earth's land mass (and human population) is located in the Northern Hemisphere. Across the globe, it was much warmer than average across much of Mexico, Central and South America, Africa, the Middle East, and Southeast Asia. It was cooler than average across parts of Siberia, Mongolia, northeastern China, parts of northern Canada, and much of the western United States.
Select national information is highlighted below:- Australia observed its record warmest summer (December–February), due in large part to December's fourth warmest maximum temperatures and January's all-time record monthly warmth. According to the Bureau of Meteorology, the average maximum summer temperature was 1.44°C (2.59°F) above the 1961–1990 average, easily beating the previous record set in 1982/83 by 0.21°C (0.38°F). All states and territories had above average maximum and minimum temperatures for the period.
- The average December–February (winter) temperature in Norway was 0.8°C (1.4°F) below the 1961–1990 average. Southern Norway was generally cooler than average, while the north was warmer than average.
| December–February | Anomaly | Rank (out of 134 years) | Records | ||||
|---|---|---|---|---|---|---|---|
| °C | °F | Year(s) | °C | °F | |||
| –Global | |||||||
| Land | +0.71 ± 0.23 | +1.28 ± 0.41 | Warmest | 15th | 2007 | +1.45 | +2.61 |
| Coolest | 120th | 1893 | -1.46 | -2.63 | |||
| Ties: 1992 | |||||||
| Ocean | +0.43 ± 0.04 | +0.77 ± 0.07 | Warmest | 8th | 1998, 2010 | +0.57 | +1.03 |
| Coolest | 127th | 1911 | -0.48 | -0.86 | |||
| Land and Ocean | +0.51 ± 0.10 | +0.92 ± 0.18 | Warmest | 12th | 2007 | +0.75 | +1.35 |
| Coolest | 123rd | 1893 | -0.62 | -1.12 | |||
| –Northern Hemisphere | |||||||
| Land | +0.61 ± 0.25 | +1.10 ± 0.45 | Warmest | 27th | 2007 | +1.71 | +3.08 |
| Coolest | 108th | 1893 | -1.80 | -3.24 | |||
| Ties: 1914 | |||||||
| Ocean | +0.44 ± 0.06 | +0.79 ± 0.11 | Warmest | 6th | 2010 | +0.57 | +1.03 |
| Coolest | 129th | 1910 | -0.47 | -0.85 | |||
| Land and Ocean | +0.50 ± 0.14 | +0.90 ± 0.25 | Warmest | 13th | 2007 | +0.97 | +1.75 |
| Coolest | 122nd | 1893 | -0.94 | -1.69 | |||
| –Southern Hemisphere | |||||||
| Land | +0.98 ± 0.13 | +1.76 ± 0.23 | Warmest | 2nd | 2010 | +1.01 | +1.82 |
| Coolest | 133rd | 1904 | -0.90 | -1.62 | |||
| Ocean | +0.44 ± 0.05 | +0.79 ± 0.09 | Warmest | 9th | 1998 | +0.60 | +1.08 |
| Coolest | 126th | 1911 | -0.50 | -0.90 | |||
| Ties: 1983, 1988 | |||||||
| Land and Ocean | +0.53 ± 0.07 | +0.95 ± 0.13 | Warmest | 4th | 1998 | +0.65 | +1.17 |
| Coolest | 131st | 1911 | -0.52 | -0.94 | |||
| Ties: 2004, 2007 | |||||||
The most current data may be accessed via the Global Surface Temperature Anomalies page.
Year-to-date (January–February)
 January–February 2013 Blended Land and Sea Surface
Temperature Anomalies in degrees Celsius
January–February 2013 Blended Land and Sea Surface
Temperature Anomalies in degrees Celsius
 January–February 2013 Blended Land and Sea Surface
Temperature Percentiles
January–February 2013 Blended Land and Sea Surface
Temperature Percentiles
The average global temperature across land and ocean surfaces for the year-to-date (January–February) tied with 2005 as the ninth warmest such period on record, at 0.56°C (1.01°F) above the 20th century average. With ENSO-neutral conditions present in the equatorial Pacific Ocean, this anomaly is higher than the same timeframe for 2011 and 2012, which were both La Niña periods, but lower than that of 2010, when El Niño was present.
| January–February | Anomaly | Rank (out of 134 years) | Records | ||||
|---|---|---|---|---|---|---|---|
| °C | °F | Year(s) | °C | °F | |||
| –Global | |||||||
| Land | +0.94 ± 0.26 | +1.69 ± 0.47 | Warmest | 11th | 2002 | +1.54 | +2.77 |
| Coolest | 124th | 1893 | -1.77 | -3.19 | |||
| Ocean | +0.41 ± 0.04 | +0.74 ± 0.07 | Warmest | 8th | 1998, 2010 | +0.56 | +1.01 |
| Coolest | 127th | 1911 | -0.49 | -0.88 | |||
| Land and Ocean | +0.56 ± 0.10 | +1.01 ± 0.18 | Warmest | 9th | 2002, 2007 | +0.75 | +1.35 |
| Coolest | 126th | 1893 | -0.69 | -1.24 | |||
| Ties: 2005 | |||||||
| –Northern Hemisphere | |||||||
| Land | +0.92 ± 0.28 | +1.66 ± 0.50 | Warmest | 12th | 2002 | +2.02 | +3.64 |
| Coolest | 123rd | 1893 | -2.21 | -3.98 | |||
| Ocean | +0.40 ± 0.06 | +0.72 ± 0.11 | Warmest | 7th | 2010 | +0.55 | +0.99 |
| Coolest | 128th | 1904 | -0.49 | -0.88 | |||
| Land and Ocean | +0.60 ± 0.15 | +1.08 ± 0.27 | Warmest | 10th | 2002 | +1.01 | +1.82 |
| Coolest | 125th | 1893 | -1.10 | -1.98 | |||
| Ties: 2005 | |||||||
| –Southern Hemisphere | |||||||
| Land | +1.00 ± 0.13 | +1.80 ± 0.23 | Warmest | 2nd | 2010 | +1.09 | +1.96 |
| Coolest | 133rd | 1904 | -0.95 | -1.71 | |||
| Ocean | +0.44 ± 0.05 | +0.79 ± 0.09 | Warmest | 11th | 1998 | +0.59 | +1.06 |
| Coolest | 124th | 1911 | -0.52 | -0.94 | |||
| Land and Ocean | +0.52 ± 0.07 | +0.94 ± 0.13 | Warmest | 7th | 2010 | +0.65 | +1.17 |
| Coolest | 128th | 1911 | -0.54 | -0.97 | |||
| Ties: 2005 | |||||||
The most current data may be accessed via the Global Surface Temperature Anomalies page.
Precipitation
The maps below represent precipitation percent of normal (left) and precipitation percentiles (right) based on the GHCN dataset of land surface stations using a base period of 1961–1990. As is typical, precipitation anomalies during February 2013 varied significantly around the world. As indicated by the February precipitation percentiles map below, record wetness was observed over north central India and part of the southeastern United States. Record dryness occurred over most of Chile, parts of northern Africa, northern Philippines, and part of far western Australia.
Legal Disclaimer:
EIN Presswire provides this news content "as is" without warranty of any kind. We do not accept any responsibility or liability for the accuracy, content, images, videos, licenses, completeness, legality, or reliability of the information contained in this article. If you have any complaints or copyright issues related to this article, kindly contact the author above.
