
2025 Proxy Season Review: Compensation-Related Matters
KEY TOPICS
Support for management say-on-pay proposals remained high
- The number of failed say-on-pay votes continued to remain low across both the S&P 500 and the Russell 3000
- Overall shareholder support averaged 90% among the S&P 500 and 91% among the Russell 3000 in H1 2025 (consistent with H1 2024)
ISS recommendations meaningfully impacted shareholder votes on say-on-pay proposals
- Compared to proposals ISS supported, proposals with negative recommendations received 26% and 22% lower support on average, respectively, at S&P 500 and Russell 3000 companies • Alignment of CEO pay with relative total shareholder return remained the most important quantitative factor underlying ISS negative recommendations
- Limited, opaque or undisclosed performance goals became the most often cited qualitative factor underlying ISS negative recommendations and use of above-target payout was the second-most cited (compared to the use of above payout target as the most often cited in H1 2024)
SEC Roundtable Discussion
- The June 2025 SEC roundtable on executive compensation disclosure requirements highlighted that while stakeholders are aligned that the current rules can be improved, there is less consensus as to how they should be revised
Shareholder support for equity compensation plans was consistent with H1 2024
- Average support was 90% among the S&P 500 and 88% among the Russell 3000 in H1 2025 (vs. 92% and 88% in H1 2024)
- All plans passed among the S&P 500 and only two failed among the Russell 3000 (vs. 0 and 5 in H1 2024)
INTRODUCTION
Our annual proxy season review memo summarizes significant developments relating to the 2025 U.S. annual meeting proxy season. This post covers shareholder votes on say-on-pay and equity compensation plans.
This publication covers votes at annual meetings of S&P 500 and Russell 3000 companies through June 30, 2025. We estimate that around 90% of U.S. public companies held their 2025 annual meetings by that date. The data on say-on-pay negative recommendations derives from ISS and FactSet information and SEC disclosure summarizing the rationale for the negative recommendations issued by ISS. We have supplemented this data with information published by companies and shareholders, and based on our independent research, experience and knowledge.
For a comprehensive discussion of U.S. public company governance, disclosure and compensation, see the Public Company Deskbook: Complying with Federal Governance and Disclosure Requirements (Practising Law Institute) by our colleagues Marc Trevino and Benjamin Weiner, available at 1-800-260- 4754 (1-212-824-5700 from outside the United States) or http://www.pli.edu.
PART 2. COMPENSATION-RELATED MATTERS
A. STRONG SAY-ON-PAY RESULTS [1]
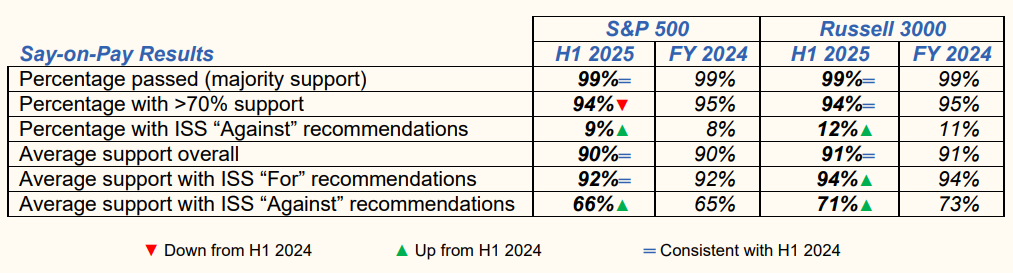
Say-on-pay voting results remained strong in 2025. The number of failed votes remained low, although increased marginally compared to the ten-year low achieved across both the S&P 500 and the Russell 3000 in H1 2024. Specifically, the number of companies with failed say-on-pay votes rose to five among S&P 500 companies (compared to three in H1 2024) and 27 among Russell 3000 companies (compared to 26 in H1 2024). Across both indices, 99% of say-on-pay proposals passed (consistent with both indices in H1 2024).
Average shareholder support for say-on-pay proposals voted in H1 2025 was 90% among the S&P 500 and 91% among the broader Russell 3000, consistent with H1 2024. Looking at the S&P 500 companies broken down by industry, those in the healthcare sector had the lowest average support at 86% and those in the energy/utilities sector had the highest average support at 92%. In H1 2025, there were S&P 500 companies with failed say-on-pay votes in the healthcare, technology, industrial and real estate sectors (compared to only the technology and industrial sectors in H1 2024).
There continued to be significant year-over-year turnover in failed votes. Of the companies with failed 2024 say-on-pay votes that had their say-on-pay votes in H1 2025, all of the S&P 500 companies (four) and all but one of the broader Russell 3000 companies (18 out of 19) achieved majority support in 2025. This level of turnover was consistent with that seen in H1 2024 for S&P 500 companies (100% in H1 2024) and a meaningful improvement for Russell 3000 companies (95% vs. 85% in H1 2024). In addition, all four S&P 500 companies that failed in 2024 and passed in H1 2025 received shareholder support of over 70% of votes cast in 2025, while 12 of the 18 Russell 3000 companies that failed in 2024 and passed in H1 2025 received shareholder support of over 70% of votes cast in 2025. [2] Finally, of the 27 companies in the Russell 3000 that had failed say-on-pay votes in H1 2025, one had a failed vote in the prior year and five additional companies had support levels below 70% in the prior year (compared to six and six out of 26 in H1 2024, respectively). Overall, these numbers indicate that companies with failed votes continue to be successful in implementing changes that result in better say-on-pay outcomes in the subsequent year.
Consistent with prior years, ISS recommendations meaningfully impacted shareholder votes. Compared to the proposals supported by ISS, say-on-pay proposals with negative ISS recommendations received 26% and 22% lower support on average, respectively, at S&P 500 and Russell 3000 companies. As further discussed below, the most significant factors underlying ISS’s negative recommendations in 2025 were the misalignment between CEO pay and shareholder return, as well as limited, opaque or undisclosed performance goals, the use of above-target payouts and the granting of one-off awards resulting in high executive compensation. ISS is likely to remain focused on these performance- and size-related compensation concerns in 2026 in light of the continued economic uncertainty facing global markets.
B. OVERALL ISS APPROACH ON SAY-ON-PAY EVALUATION
When making a recommendation on a say-on-pay proposal, ISS uses a multipronged approach to assess executive compensation. [4] ISS will recommend a vote against a company’s say-on-pay proposals if any of the following is true:
- there is a significant misalignment between CEO pay and company performance (pay-forperformance), as discussed in detail in Section C below;
- the company maintains significant problematic pay practices (for example, excessive change-incontrol or severance packages, benchmarking compensation above peer medians, repricing or backdating of options, or excessive perquisites or tax gross-ups); or
- the board’s communication with and responsiveness to shareholders are significantly poor.
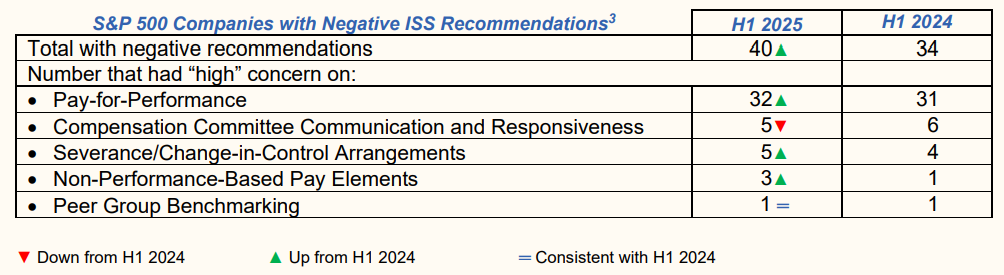
ISS applies these standards by assigning companies a “high,” “medium” or “low” level of concern for each of the five evaluation criteria listed in the above table. As the table illustrates, although pay-forperformance is just one factor in the overall compensation assessment, it remains the main factor correlating to ISS’s negative recommendation on the say-on-pay vote, as has been the case in recent years. Interestingly, although the percentage of negative recommendation reports indicating “high” concern on this issue decreased this year (80% vs. 91% in H1 2024), it remains the most prevalent criterion among companies that received negative recommendations by over 67 percentage points.
Consistent with 2024, ISS also issued negative recommendations based on perceived issues with compensation committee communication and responsiveness, highlighting the importance of engagement with shareholders on matters relating to compensation. [5] Of the five companies that received both a negative recommendation and a “high” concern rating on compensation committee communication and responsiveness, two companies had a “high” concern solely under this criterion. [6] Notably, both of these companies received a “low” initial quantitative concern rating with respect to pay-for-performance and one of them also received a “low” qualitative concern rating with respect to pay-for-performance.
In H1 2025, consistent with prior years, and despite the number of submitted compensation-related Rule 14a-8 proposals decreasing by 16% compared to H1 2024, severance was the most prevalent issue underlying submissions on compensation, representing 48% of such proposals (see Section H of Part 1 of this memo). ISS also maintained its focus on severance arrangements, ascribing “high” concern on this criterion to five companies to which it issued negative recommendations in H1 2025 (vs. four in H1 2024).
C. DETAILS ON ISS’S APPLICATION OF ITS PAY-FOR-PERFORMANCE POLICIES IN H1 2025
Since the 2012 proxy season, the first step in the pay-for-performance prong of ISS’s executive compensation assessment has been a quantitative analysis of both relative and absolute alignment of pay-for-performance. [7] Even if a company receives a “low” concern rating through this quantitative payfor-performance model, ISS will review all of the company’s Compensation Discussion and Analysis sections and incentive programs to highlight noteworthy issues to investors. Problematic incentive designs, such as multi-year guaranteed payments, discretionary pay components, inappropriate perquisites, or lack of rigorous goals are generally addressed in the qualitative analysis and may result in a “high” overall concern with respect to pay-for-performance despite a “low” initial quantitative concern level. [8]
1. Components of Quantitative Analysis
ISS’s quantitative pay-for-performance screen uses four measures, which were slightly modified in December 2024:
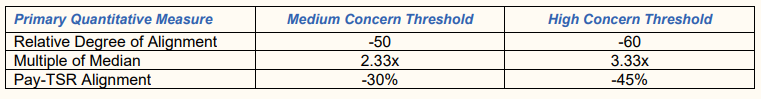
- Relative Degree of Alignment, or RDA (relative alignment of CEO pay and total shareholder return over three years). The metric that is given the greatest weight in the quantitative assessment is the alignment of CEO pay and TSR, [9] relative to a comparison group of 12–24 companies selected by ISS on the basis of size, industry, market capitalization and other factors. To determine RDA, the company’s percentile ranks are calculated for three-year average pay and for annualized three-year TSR performance. The RDA measure is equal to the difference between the ranks: the performance rank minus the pay rank. The threshold for receiving “high” concern is a difference of 60 percentile points or more. This metric continued to be the strongest predictor of ISS recommendations and of overall voting results. Of the 40 S&P 500 companies that received a negative ISS recommendation on say-on-pay in H1 2025, 15 received a “high” concern for RDA (compared to 18 out of 34 companies in H1 2024).
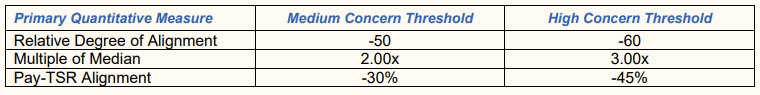
- Multiple of Median, or MOM (relative CEO pay to peer group median over one year). This metric considers pay independent of company performance. This metric is calculated by dividing the company’s one-year CEO pay by the median pay for the comparison group. ISS’s scoring system may trigger a “high” concern if this multiple is 3.00x or higher for S&P 500 companies (3.33x or higher for non-S&P 500 companies). ISS research reports also include a three-year MOM; the three-year MOM is not part of the quantitative screen methodology but may inform ISS’s qualitative evaluation.
- Pay-TSR Alignment, or PTA (absolute alignment of CEO pay and TSR over five years). The third component measures alignment between the long-term trend in the CEO’s pay and the company’s shareholder returns. This does not depend on year-by-year sensitivity of CEO pay to changes in TSR, but instead compares the slopes of weighted linear regressions for pay and for shareholder returns over a five-year period. A “high” concern may be triggered if the CEO pay trend slope exceeds the TSR trend slope by 45 percentage points or more. For the first time in more than five years, none of the S&P 500 companies that received a negative ISS recommendation on say-on-pay during the first half of the applicable year received a “high” concern for PTA.
- Financial Performance Assessment, or FPA (relative alignment of CEO pay and financial performance over three years). The FPA relative measure is applied as a secondary measure after the three primary screens above are calculated. It compares the percentile ranks of a company’s CEO pay and financial performance across four Economic Value Added (EVA) metrics, relative to an ISS-derived comparison group, over the prior two-year or three-year period. The FPA requires a minimum two-year period of CEO pay and EVA data; if insufficient data exists for either metric, the FPA screen will be excluded. The FPA screen generally utilizes four equally weighted EVA-based metrics: (1) EVA margin; (2) EVA spread; (3) EVA momentum vs. sales; and (4) EVA momentum vs. capital.
The “medium” concern and “high” concern thresholds for non-S&P 500 companies are summarized below.
For S&P 500 companies, the MOM “medium” and “high” concern thresholds are slightly lower, likely due to greater investor scrutiny on CEO compensation among large-cap companies. The “medium” concern and “high” concern thresholds for S&P 500 companies are summarized below.
Based on the preceding, ISS will assign an initial quantitative score (ISS may deem multiple “medium” concern levels as the equivalent of an overall “high” quantitative concern). ISS then applies the FPA score as a potential modifier. The FPA could modify the initial score (a) if a company has a “medium” concern under any of the three primary measures, (b) if a company has a “low” concern that borders on a “medium” concern threshold under any of the three primary measures, or (c) if a company has only one individual elevated concern (“medium” or “high”) under the three primary measures (e.g., certain “medium” concern companies with poor FPA performance may become “high” concerns). [10]
2. Results of ISS Quantitative Analysis in H1 2025
In H1 2025, 19 companies out of the 40 that received a negative recommendation on their say-on-pay proposals did so despite attracting only “low” overall concern on the quantitative screen (vs. 10 out of 34 in H1 2024 and nine out of 42 in H1 2023), reflecting a notable increase. Five of these companies received a negative recommendation despite attracting “low” overall concern on both the quantitative and qualitative screens (compared to two in both H1 2024 and H1 2023). These results appear to suggest that, in issuing a negative recommendation against a company’s say-on-pay proposal, ISS is placing slightly less emphasis on its quantitative factors than it did in prior years. The impact of the FPA on ISS’s analysis was also mixed this year, with three companies moving from “low” to “medium” concern as a result of the FPA (vs. no companies in H1 2024) and two companies moving from “medium” to “high” concern (vs. four companies in H1 2024). Twenty-seven of the companies that received a negative recommendation remained at the same level of concern as they had been following the RDA, MOM, and PTA tests.
3. ISS Qualitative Analysis
Under ISS’s policies, the qualitative review takes into account a range of factors, including: • the ratio of performance- to time-based incentive awards;
- the overall ratio of performance-based compensation to fixed or discretionary pay; • the transparency and clarity of disclosure;
- the complexity of the pay program;
- any risks associated with the pay program design;
- the emphasis of objective and transparent metrics;
- the rigor of performance goals;
- the application of compensation committee discretion;
- the magnitude of pay opportunities;
- the company’s peer group benchmarking practices;
- financial/operational results, both absolute and relative to peers, including clear disclosure in the proxy of any adjustments made for incentive plan purposes;
- special circumstances such as CEO and executive turnovers or unusual grant practices (e.g., biannual awards, special one-time grants);
- recent pay program changes and/or any forward-looking commitments;
- realizable and realized pay compared to granted pay; and
- any other factors ISS deems to be relevant.
Based on our review of the narrative in the relevant ISS reports, the inclusion of limited, opaque or undisclosed performance goals was the most frequently cited qualitative factor in H1 2025. ISS specifically cited this concern for 27 of the 40 S&P 500 companies that received negative ISS recommendations on say-on-pay in H1 2025 (vs. 19 of 34 in H1 2024). The continued significance of this qualitative factor, which has been one of the top two most-cited concerns since 2020, is consistent with ISS’s focus on pay-for-performance alignment in the quantitative assessments.
Similar to last year, the use of above-target payouts was another frequently cited concern. Of the 40 S&P 500 companies that received negative ISS recommendations in H1 2025, 23 companies were described as providing such payouts (vs. 24 out of 34 in H1 2024), which can be suggestive of weak performance standards. However, consistent with last year, in many cases ISS did not specifically criticize the payouts and instead merely noted them as part of its overall assessment of performance-based compensation. For example, for 10 of the 23 companies identified as having above-target payouts that received negative recommendations in H1 2025, ISS also cited performance conditions that were not sufficiently rigorous (vs. 13 of 24 in H1 2024). This once again indicates that other factors may have a larger impact on ISS’s decision to recommend against a company’s say-on-pay proposal.
ISS also demonstrated a focus on the grant of one-off awards that resulted in high executive compensation. In H1 2025, ISS cited more than half (22 out of 40) of the S&P 500 companies that received negative recommendations for providing large recruitment, retention, performance or frontloaded awards to executive officers.
The other concerns ISS identified generally fell into the following categories (with most companies receiving more than one of these concerns):
- The use of performance conditions that are not sufficiently rigorous. Of the 40 S&P 500 companies with negative ISS recommendations, ISS identified 18 as having performance standards that were not sufficiently rigorous (vs. 16 of 34 in H1 2024). Beyond the typical concern of using performance goals that are too easy to meet or not sufficiently meaningful, additional critiques involved the granting of new awards with lower performance targets compared to prior years without reducing payout opportunities, as well as the modification of in-cycle awards to extend the performance period.
- Large perquisites. Sixteen of the 40 S&P 500 companies were criticized by ISS for providing excessive perquisites (vs. 13 of 34 in H1 2024). ISS specifically mentioned security services and aircraft use in thirteen and seven of these cases, respectively. Consistent with H1 2024, other frequently mentioned perquisites include car services and tax gross-ups.
- Sizeable compensation. ISS cited 14 of the 40 S&P 500 companies as providing outsized compensation through non-performance-based pay elements, including through large base salaries and time-based awards. Eight of these companies were also noted as providing one-off awards that resulted in high executive compensation, demonstrating an element of overlap.
- The use of time-based incentive awards rather than performance-based incentive awards. ISS identified this concern at 11 of the 40 S&P 500 companies (vs. 12 of 34 companies in H1 2024). The failure by ISS to consider time-based vesting awards to be a robust measure of performance has been the subject of criticism because time-based equity awards can give holders a stake in the performance of the company and align the interests of executives with those of shareholders. However, awards granted subject to performance-based conditions are considered to be a matter of good governance by many stakeholders.
- The use of subjective criteria for determining compensation. ISS criticized 11 of the 40 S&P 500 companies for using subjective criteria for the determination of bonuses or permitting discretion to increase executives’ compensation. ISS generally viewed the use of discretion by companies as a means of excusing lackluster performance.
D. SECURITY PERQUISITES
As previously mentioned, 13 of the 40 S&P 500 companies that received negative ISS recommendations in H1 2025 were cited as providing excessive security perquisites to their executives (vs. seven in H1 2024). Security is also often cited as a justification for executive use of corporate aircrafts, for which ISS critiqued seven of the 40 S&P 500 companies in H1 2025 (vs. six in H1 2024). The apparent increase in corporate spending on security measures is not surprising in light of recent events. Also unsurprisingly, there has been increasing public dialogue in 2025 regarding whether company-funded security measures are better categorized as providing a personal benefit to the executive or representing a necessary business expense, particularly with respect to high-profile chief executive officers. As discussed in Section E below, this dialogue has made its way to the SEC, which is currently considering whether to propose revisions to the executive compensation proxy disclosure rules. Ultimately, so long as executive security is considered a “perquisite” under such rules, corporate expenditure on such measures is likely to remain a touchstone for public companies, proxy advisory firms, institutional investors and the general public.
E. SEC ROUNDTABLE DISCUSSION
On June 26, 2025, the SEC hosted a roundtable discussion regarding executive compensation disclosure requirements. Panelists consisted of representatives from several public companies, investors, compensation consultants and law firms, who discussed, among other topics, the evolution of the disclosure rules, the pros and cons of the current disclosure regime and how the disclosure requirements should look in the future.
While there was general agreement among the panelists that the current disclosure rules are unsatisfactory, there was limited consensus as to how the rules should be revised. Unsurprisingly, the largest difference of opinion was between representatives from public companies and investors. Public companies, on the one hand, generally promoted the simplification of the disclosure rules, citing the large expense of generating the required information. Investors, on the other hand, generally requested additional disclosure, particularly with respect to equity and performance-based awards. The roundtable also touched on the treatment of security benefits as perquisites for SEC disclosure purposes. While several panelists felt that executive security was critical to the success of a business and therefore should not be considered a perquisite, some investors disagreed.
The SEC has requested public comments on the executive compensation disclosure requirements (form available here). It is expected that the SEC will subsequently propose revisions to the rules, taking into consideration the recommendations raised in such comment letters and at the roundtable.
F. EQUITY COMPENSATION PLAN VOTING [11]
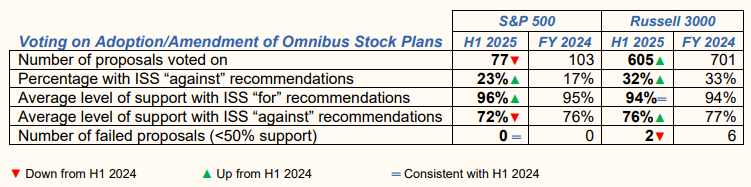
U.S.-listed companies generally are required under stock exchange rules to obtain shareholder approval for the plans under which they award equity-based compensation to employees, directors or other service providers. [12] Because shareholders generally support the use of equity compensation by public companies as a means to align the interests of employees with those of investors, in most cases these proposals are uncontroversial and pass by a wide margin. The support levels for these proposals usually average around 90%, and this proxy season was no different. Average support for equity compensation plan proposals voted in H1 2025 averaged 90% among the S&P 500 and 88% among the Russell 3000 in H1 2025 (vs. 92% and 88% in H1 2024).
Since 2015, ISS has applied an “equity scorecard” approach to assessing equity plans. The scorecard method considers factors under three main categories: [13]
- Plan cost. Cost is calculated as the Shareholder Value Transfer relative to industry/market-cap peers; this measures the dilutive effect of the new shares requested as well as shares remaining for issuance under existing plans (often called “dilution” or “overhang”), and is calculated both with and without outstanding unvested awards.
- Plan features. Specifically, penalizing lack of minimum vesting periods, broad discretionary vesting authority, liberal share recycling, lack of specific disclosure regarding change-in-control provisions, and the ability to pay dividends prior to the vesting of the underlying award.
- Grant practices. Specifically, three-year “burn rate” relative to market and industry peers, among other factors.
There was a slight uptick in ISS recommendations against. ISS recommended against approximately 32% of equity plan proposals in the case of Russell 3000 companies in H1 2025 (vs. 29% in H1 2024), but recommended against only 23% in the case of S&P 500 companies (vs. 17% in H1 2024). For several of these S&P 500 companies, ISS cited broad discretionary accelerated vesting authority, excessive plan cost, excessive burn rate and liberal share recycling among the reasons for its negative recommendation. Despite the negative recommendations, all of the proposals at S&P 500 companies (and all but two proposals at Russell 3000 companies) received majority support. [14]
Even though ISS recommendations did not seem to impact pass rates, they continued to have a fairly significant impact on voting results. In H1 2025, the average support level for equity plan proposals at S&P 500 companies was 96% when ISS recommended “for” approval and 72% when ISS recommended “against” (vs. 95% and 75% in H1 2024).
1Unless otherwise noted, we present H1 2025 and full-year 2024 data in the tables throughout this publication for completeness, although the indicative symbols used in the tables compare H1 2025 with H1 2024 data, rather than the full-year 2024 data presented. In addition, in the discussion we generally assess year-over-year changes by comparing H1 2025 and H1 2024 data for consistency.(go back)
2If a company receives less than 70% shareholder support for its say-on-pay vote, ISS will conduct a qualitative review of the compensation committee’s responsiveness to shareholder opposition at the next annual meeting, which could lead to negative recommendations against the members of the compensation committee.(go back)
3The numbers for the categories add up to more than the total because some companies received “high” concern in more than one category.(go back)
4Glass Lewis’s executive compensation assessment policy appears to be less formulaic than ISS’s, though Glass Lewis publicly discloses fewer details on its policy than does ISS. Based on Glass Lewis’s published information, it evaluates compensation based on five factors: overall compensation design and structure, implementation and effectiveness of compensation programs, disclosure of executive compensation policies and procedures, amounts paid to executives, and the link between pay and performance. In evaluating pay-for-performance, Glass Lewis looks at the compensation of the top five executive officers, not just the CEO. In addition, Glass Lewis looks at performance measures other than total shareholder return—it measures performance based on a variety of financial measures and industry-specific performance indicators.(go back)
5ISS policies emphasize the importance of clear communication with shareholders on compensation issues, particularly for companies that receive low support for say-on-pay proposals. See ISS United States Compensation Policies Frequently Asked Questions (Dec. 13, 2024), available at https://www.issgovernance.com/file/policy/active/americas/US-Compensation-Policies-FAQ.pdf (“When a say-on-pay proposal receives less than 70% support of votes cast (for and against), ISS will conduct a qualitative review of the compensation committee’s responsiveness . . . tak[ing] into consideration . . . disclosure of details on the breadth of engagement . . . [and] disclosure of specific feedback received from investors on concerns that led them to vote against the proposal.”).(go back)
6The two companies were BlackRock, Inc. and Live National Entertainment, Inc. ISS narratives for both companies identified perceived inadequate responses to low say-on-pay votes in prior years.(go back)
7Technical information and guidance on ISS’s say-on-pay methodology is available at https://www.issgovernance.com/file/policy/active/americas/Pay-for-Performance-Mechanics.pdf.(go back)
8See ISS Pay-for-Performance Mechanics: ISS’ Quantitative and Qualitative Approach (Dec. 16, 2024), available at https://www.issgovernance.com/file/policy/active/americas/Pay-for-PerformanceMechanics.pdf.(go back)
9TSR measures how much an investment in the stock would have changed over the relevant period, assuming the reinvestment of dividends.(go back)
10See ISS Pay-for-Performance Mechanics: ISS’ Quantitative and Qualitative Approach (Dec. 16, 2024), available at https://www.issgovernance.com/file/policy/active/americas/Pay-for-PerformanceMechanics.pdf. ISS updated the thresholds for eligibility for an FPA adjustment in the Relative Degree of Alignment and Multiple of Median (for non-S&P 500 companies) categories, effective beginning February 1, 2025.(go back)
11This section compares data on proposals for shareholder meetings held through full-year 2024 and H1 2025.(go back)
12See Section 303A.08 of the NYSE Listed Company Manual; Nasdaq Stock Market Rule 5635.(go back)
13ISS’s current equity plan scorecard approach is described in its United States Equity Compensation Plans Frequently Asked Questions, available at https://www.issgovernance.com/file/policy/active/americas/US-Equity-Compensation-Plans-FAQ.pdf. Effective for meetings as of February 1, 2024, the passing score is 53 for all models except (i) the S&P 500 model, which has a passing score of 59, (ii) the Russell 3000 model, which has a passing score of 57 and (iii) the non-Russell 3000 model, which has a passing score of 55. There were no new changes to passing scores for 2025. Certain egregious equity plan features may result in a negative ISS recommendation, regardless of the “equity scorecard.” These egregious features include, for example, “a liberal [change-of-control] definition that could result in vesting of awards by any trigger other than a full double trigger.” (go back)
14According to ISS, proposals to adopt or amend omnibus stock plans failed to receive greater than 50% shareholder support at two Russell 3000 issuers, both of which received negative ISS recommendations: Forge Global Holdings, Inc. (just below 20%) and MaxLinear, Inc. (just below 30%).(go back)
Legal Disclaimer:
EIN Presswire provides this news content "as is" without warranty of any kind. We do not accept any responsibility or liability for the accuracy, content, images, videos, licenses, completeness, legality, or reliability of the information contained in this article. If you have any complaints or copyright issues related to this article, kindly contact the author above.
