
Navigating the Emissions Landscape: Uneven Paths to Decarbonization
Greenhouse gas emissions and corporate efforts to reduce them have become central to the climate change discussion in recent years. As corporate disclosures on climate and emissions gain prominence, including through regulatory mandates, the focus is now shifting towards tangible actions and measurable outcomes in climate mitigation and decarbonization. While climate adaptation remains a critical part of the equation, GHG emissions reduction targets have emerged as a key tool for addressing climate challenges.
A growing number of companies are setting ambitious GHG emissions reduction goals, and those that commit to more rigorous science-based targets tend to show more meaningful progress. However, substantial challenges remain in reaching long-term climate objectives. As companies work to meet their targets, robust decarbonization strategies, tailored to their specific exposure and industry considerations, will be essential for success. ISS-Corporate analyzed global corporate disclosure data on GHG emission and reduction targets, evaluating the current levels of transparency, exposure, and sector-specific commitments toward decarbonization. Our research reveals the following key findings:
- Growth in Emissions Disclosures: Emissions disclosures have increased substantially in the past five years, effectively becoming the norm in corporate reporting for many market segments, in response to and in alignment with market expectations and emerging regulations.
- Sector-Specific Emissions Concentration: Direct GHG emissions and emissions related to purchased energy (Scope 1 & 2) are heavily concentrated in a few sectors, such as materials, energy, utilities, and industrials. These industries face the greatest challenge in adapting to and leading the energy transition.
- Scope 3 Emissions Complexity: Scope 3 emissions (indirect GHG emissions as a result of company activities along the value chain) continue to pose significant challenges in terms of calculation and reporting. However, current disclosure trends highlight that all sectors, even low-emitting industries, face unique exposure characteristics due to varying upstream and downstream dependencies.
- Effectiveness of Science-Based Targets: Companies making commitments that align with the Science Based Targets initiative have been more effective in reducing their emissions. Companies with verified net zero science-based targets also demonstrate lower Scope 3 emissions than those whose targets are not aligned with the Science-Based Targets Initiative.
- The Need for Decarbonization Strategies: To help mitigate climate impacts and to improve stakeholder sentiment, companies will need to develop decarbonization strategies that align with global objectives related to climate, as they are expected to manage emissions across the entire value chain.
GHG Emissions Disclosures Continue to Rise
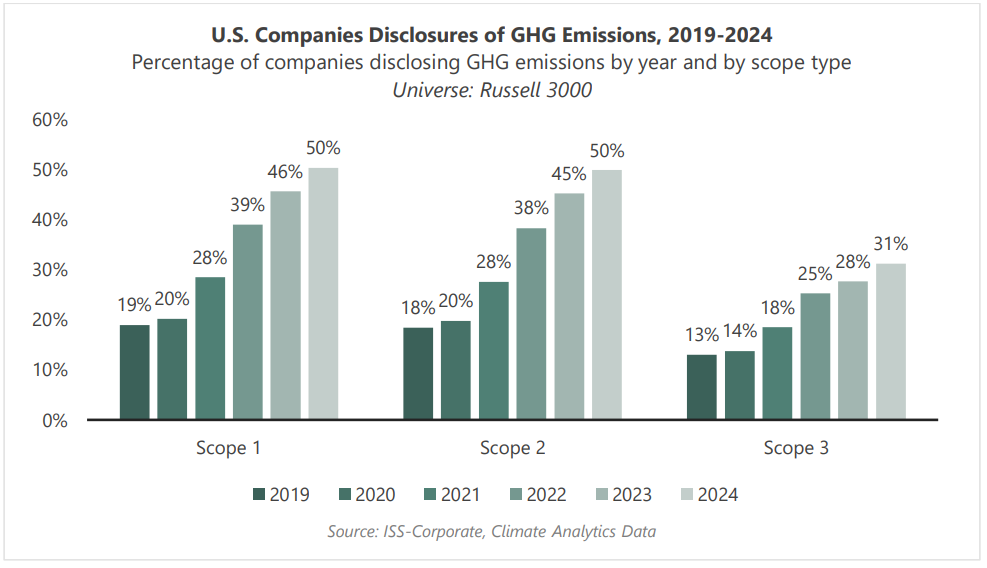
Corporate disclosures of GHG emissions have increased significantly in recent years. In the U.S. market, where disclosures remain voluntary the percentage of companies disclosing Scope 1 and Scope 2 emissions has risen to more than 50% of Russell 3000 companies in 2024 from less than 20% in 2019. S&P 500 companies currently disclose Scope 1&2 emissions at a rate of 95%, up from 70% in 2019. Smaller companies have shown a more dramatic increase in reporting, with non-S&P 500 Russell 3000 companies reporting Scope 1&2 emissions at a rate of approximately 41% in 2024, compared with only 8% in 2019.
Scope 3 emissions disclosures have also continued to increase steadily, with close to one-third (31%) of Russell 3000 companies providing some level of information on indirect GHG emissions across the value chain in 2024, compared to only 13% in 2019. The rate of disclosure among S&P 500 companies stands at 79%, while smaller companies have demonstrated meaningful progress in this area in the past five years. Scope 3 reporting remains a significant challenge for companies, as calculating emissions along the entire value chain is a complex exercise even for organizations with relatively simple operations. With several regulatory initiatives on climate reporting expected to become effective in the coming years, companies will likely need to focus their efforts on calculating Scope 3 emissions, especially where they are deemed to be material.
When reviewing disclosure levels by global region, publicly traded companies in the Americas appear to lag their counterparts in EMEA and Asia Pacific. Disclosures in EMEA, primarily driven by regulatory mandates and established business norms in Europe, report Scope 1 & 2 emissions at a rate of 88%, while approximately 75% report on Scope 3 emissions.
The Asia Pacific region also demonstrates high levels of disclosure, with 83% of companies under coverage disclosing Scope 1&2 emissions, and 56% disclosing Scope 3. The trend in Asia Pacific is primarily driven by markets that have established regulatory requirements on climate reporting, including Hong Kong, Taiwan, Japan, South Korea and India. As China and Australia are also moving forward with new reporting requirements, the level of disclosure in the region is expected to continue to increase. About 45% of companies under coverage in the Americas disclose Scope 1&2 emissions, and about 28% disclose Scope 3 emissions. The figures in the Americas are driven by disclosures in the U.S. (including Russell 3000 and non-Russell micro-cap firms). Notably, large-cap companies in Canada, Brazil, Mexico, and Chile under coverage disclose carbon emissions at a relatively high rate.

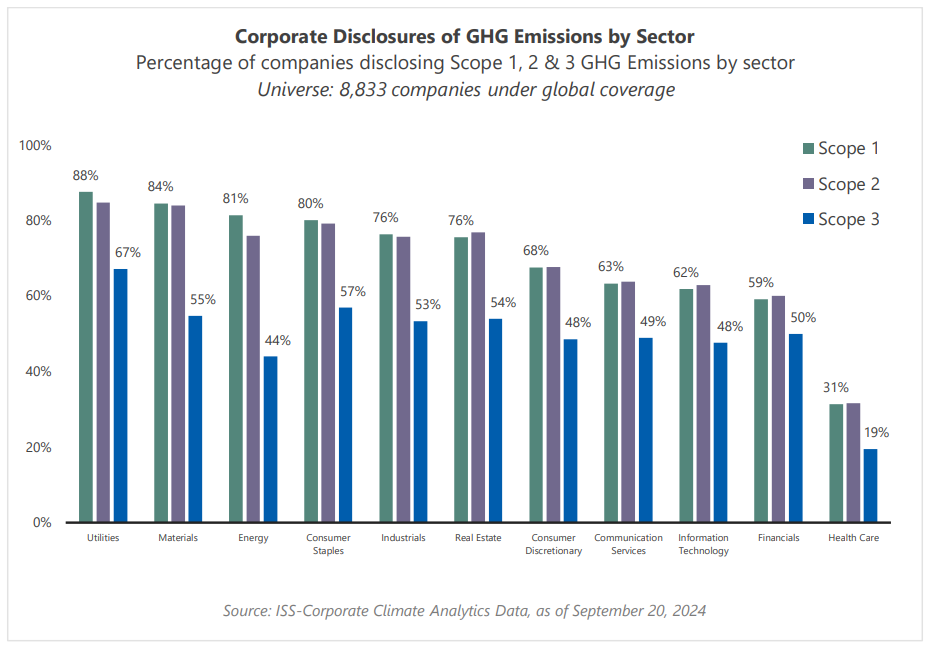
When observing disclosure rates by sector, it becomes evident that materiality plays a key role. The highest levels of Scope 1 & 2 emissions disclosure take place in some of the most carbon-intensive sectors, with Utilities, Materials, and Energy companies reporting at a rate of more than 80%. Scope 3 disclosures appear somewhat less varied, with most sectors demonstrating disclosure rates between 45% and 55%. The Utilities sector leads in Scope 3 disclosure, with 67% of companies providing this information. Scope 3 emissions disclosure levels in the Energy sector are lower than most other industries (44%), despite such emissions being most relevant for the industry. The Healthcare sector has the lowest level of disclosure, reflecting the generally lower maturity in sustainability disclosures more broadly, as the sector encompasses the highest proportion of small-cap and micro-cap firms.
GHG Emissions Are Highly Concentrated in Key Sectors
When analyzing actual GHG emissions data as disclosed by companies, it becomes evident that a relatively small number of sectors face the greatest exposure to climate transition risk given their relatively higher levels of energy use. Decarbonization efforts and adapting to a low-carbon economy would require significant adjustments and technological changes for these industries. Companies in the Materials, Utilities and Energy sectors account for more than 80% of total Scope 1 and Scope 2 reported emissions, followed by Industrials sector, which includes the Transportation and Capital Goods industry groups. These trends align with the broader understanding that these key industries are the primary contributors to global emissions.
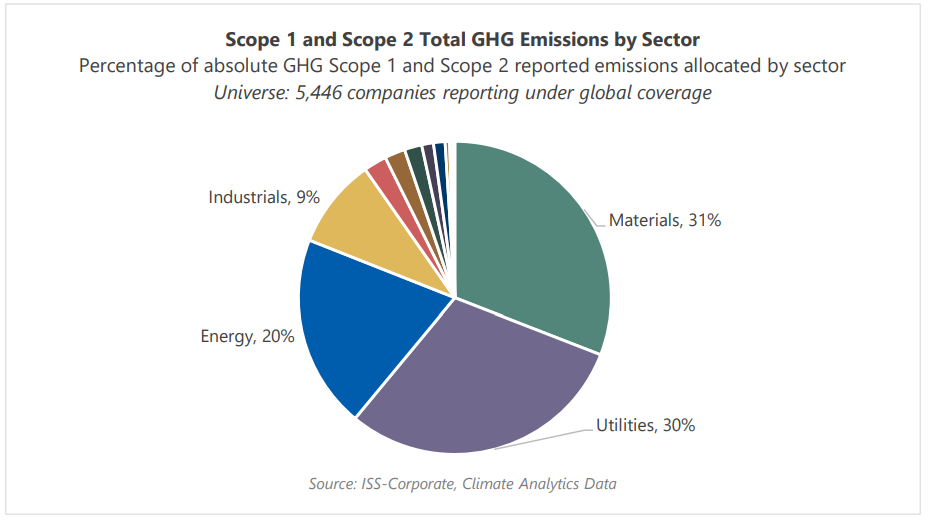
The picture is similar comparing emissions intensity (as a ratio of revenue) across sectors. Utilities, Energy and Materials dominate in the Scope 1 and Scope 2 emissions measured by intensity. Emissions intensity can help companies benchmark themselves to their peers with as it allows a consistent measurement of emissions compared with revenue generated.
In the Utilities sector, renewable energy generation has increased steadily in recent years, and in 2023, more than 20% of all U.S. electricity was generated from renewables, including wind, hydropower and solar. [1] However, the sector still heavily relies on fossil fuel – natural gas, coal, and oil – for power generation. Emissions intensity in the Energy and Materials sectors are high because of the energy used to extract and process raw materials. The Materials sector demonstrates the greatest Scope 2 footprint compared to all other sectors.
Several sectors experience higher emissions intensity levels from their Scope 2 footprint than direct emissions (Scope 1), as the consumption of purchased energy, such as electricity, steam, heating, and cooling plays a significant role in operations. Real Estate, Consumer Discretionary, and Information Technology are notable examples of such sectors. While companies in these sectors face lower energy intensity in their operations compared to high-emitting sectors, the difference in their carbon footprint composition can affect their decarbonization strategies, with a greater potential emphasis on the purchase of energy from renewable sources.

Scope 3 Reporting Remains a Challenge
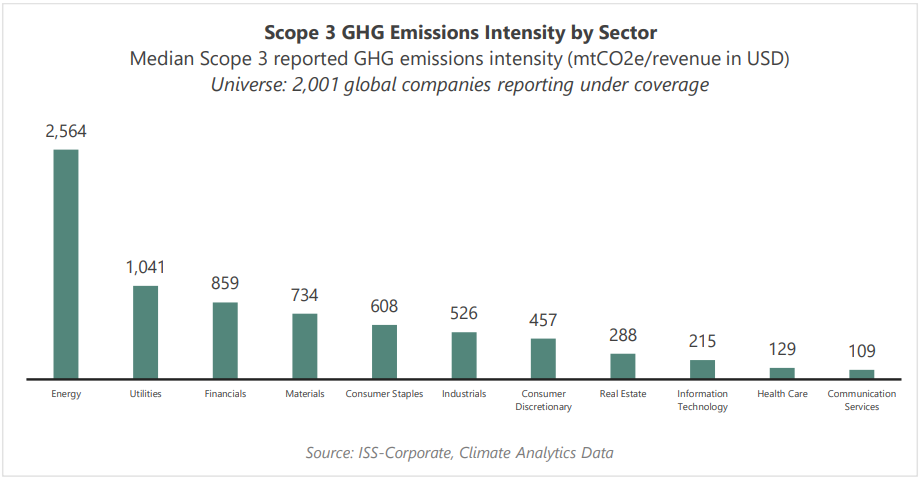
The quality of Scope 3 emissions reporting likely has substantial room for improvement across most industries, particularly among companies that are just starting to report indirect emissions throughout the value chain. Gathering accurate data from suppliers, partners, and customers can be difficult, and estimating upstream and downstream emissions may be even harder. Calculations may require sophisticated methods for tracking and estimation, which may also include relying on industry averages or benchmarks. That said, an analysis of reported Scope 3 emissions data reveals interesting trends, with significant implications for corporate decarbonization strategies.
Not surprisingly, Energy and Utilities firms demonstrate the highest levels of carbon intensity due to their downstream effects. However, the Financials sector, which accounts for only 0.3% of total global Scope 1 and Scope 2 emissions, shows the third highest level of carbon intensity in its value chain emissions, primarily due to financed emissions, which are on-balance-sheet emissions from direct lending and investment activities. The Consumer Staples and Industrial sectors also show significant scope 3 emissions through both upstream and downstream impacts.
Scope 1&2 Targets: Common yet Varied
While transparency in emissions reporting lays the foundation for accountability and management, a review of GHG reduction targeting practices can us help better understand companies’ mitigation efforts and their impact. Setting a GHG emissions reduction target can serve as a powerful tool for driving meaningful action toward decarbonization, providing a clear roadmap for integrating climate change into long-term business strategies, helping companies identify priorities, and enhancing communication with investors and other stakeholders.
Emissions target-setting is becoming more common, but approaches may vary significantly in scope, timeline and ambition. To establish credibility in their commitments, many companies turn to science-based targets (SBTs). The Science Based Targets initiative (SBTi) looks at whether corporate GHG emissions targets are consistent with the level of decarbonization required to limit global temperature increase to 1.5°C above pre-industrial levels. SBTi’s target guidance may include near-term targets and long-term decarbonization plans in alignment with science-based definitions of net zero.
Based on a review of the relevant corporate disclosure data, all sectors demonstrate high levels of adoption of GHG reduction targets for Scope 1&2 emissions, with more than 80% of companies adopting such targets in Materials, Utilities, and Consumer Stapes. Healthcare is the only sector with fewer than half of companies adopting a target (32%).
When reviewing the status of Science-Based Targets, however, a different picture emerges. The Consumer Staples sector demonstrates the highest percentage (27%) of companies with near-term targets aligned with the SBTi, followed by Real Estate (23%), Consumer Discretionary (22%), Communication Services (21%), and Industrials (19%). By contrast, despite their significant contributions to overall emissions, only 16% of Materials and Utilities companies have set near-term targets approved by the SBTi. While 75% of Energy firms have established Scope 1&2 emissions reduction targets, none of them have received approval by the SBTi for their near-term targets initiatives, as SBTi’s methodology for this sector is under review and development.

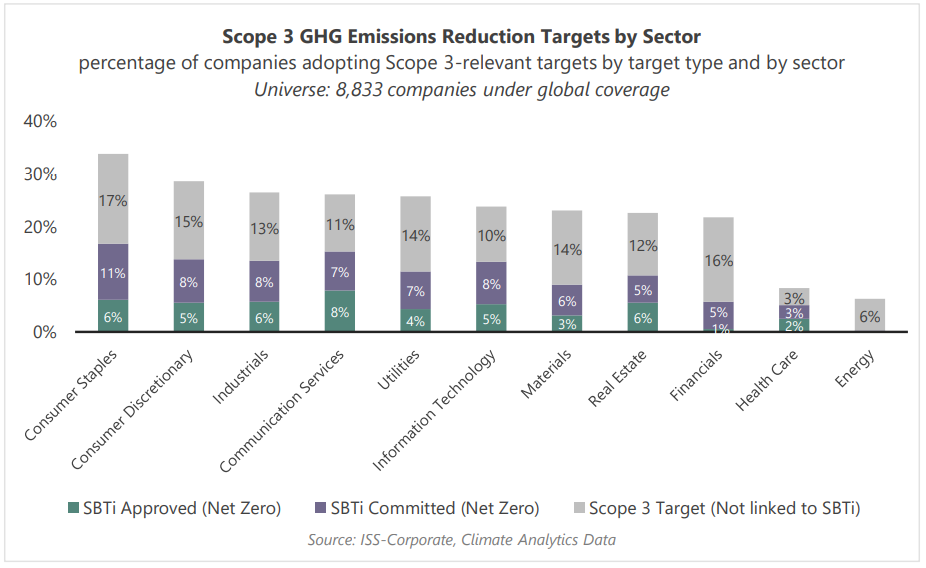
Scope 3 Targets Remain Elusive
Compared with near-term targets, net-zero targets encompass a longer timeframe – typically up to 2050 – and require more comprehensive strategies to address emissions across the entire value chain. These efforts involve extensive data collection, monitoring, and reporting processes, all of which make developing a credible net-zero strategy more challenging. In addition, reducing emissions alone will not be sufficient to achieve net zero, as companies will eventually need to address residual emissions (those that remain after all feasible reduction measures have been implemented) typically through carbon offsetting or carbon capture efforts, adding further complexity to planning and implementation. Reflecting these challenges, we see more companies with a commitment to establish SBTi-aligned targets but fewer companies with approved targets. The Consumer Staples and Consumer Discretionary sectors show the highest rate of companies adopting some form of Scope 3 emissions reduction targets. Understandably, Scope 3 reduction targets are less common among Energy firms, as the sector maintains a high dependency on fossil fuels.
Target Effectiveness: Not All Targets Are Created Equal
To determine whether setting science-based targets leads to greater emissions reductions, ISS-Corporate compared the emissions data of Utilities companies between those with SBTi-approved targets or commitments to establish them and those with targets not linked to SBTi. As illustrated in the chart below, companies with SBTi-approved targets or commitments exhibit lower median emissions levels for both Scope 1&2 and Scope 3 emissions. These trends prevail across most other sectors.

ISS-Corporate also analyzed GHG emissions data from 2019 to 2022 to assess whether companies with SBTi-approved targets were more successful in their decarbonization efforts. Among the 590 U.S. companies that reported their emissions during this period, nearly all (97%) adopted GHG reduction targets, but only 34% had set near-term targets approved by the SBTi. The box plots below illustrate that companies with near-term SBTs achieved greater reductions in Scope 1 and 2 GHG emissions than those without SBTs, both in absolute terms and relative to their reported revenue.

Decarbonization: A Challenge Across All Sectors
A review of GHG emissions data and reduction targets disclosed by corporate issuers globally shows that unique challenges lie ahead across all industries, with companies needing to develop their own path to contribute to the global goal of meeting the climate and energy transition challenge. As companies work towards their decarbonization strategies, several key steps may help in building realistic and effective climate mitigation action plans:
- Foster Commitment: Leadership and the Board need to demonstrate ownership of the organization’s decarbonization plan, in alignment with the business strategy and the degree of materiality for the firm. A culture of commitment also involves clear roles and responsibilities for implementing and driving the efforts for the company’s plan.
- Establish Robust Reporting Practices: Develop carbon inventory for operations and across the value chain leveraging established standards and emerging regulations, with the understanding that reporting effectiveness will continue to improve as the organization gains more experience.
- Work towards Clear, Science-Based Targets: As demonstrated by the data, not all targets demonstrate the same level of effectiveness. Setting a GHG reduction target that is not science-based may serve as an excellent first step in building the organization’s strategy and capacity for change. However, committing to standards-aligned science-based targets will make a significant different both in terms of strategy and communication.
- Engage Stakeholders in the Value Chain: As value chain impacts are becoming a priority for policymakers and business partners alike, a strong engagement program with suppliers, customers, and other relevant stakeholders can help improve reporting quality as well as create paths for reduction improvements.
- Monitor and Work Towards Continuous Improvement: Regular assessment of the decarbonization strategy allows for improvement to address the dynamic landscape and evolving challenges of such a difficult task involving multiple stakeholders and a high degree of uncertainty. Continuous assessment of technological changes and innovation that may impact the company’s action plan would be part of a company’s ongoing monitoring efforts.
Legal Disclaimer:
EIN Presswire provides this news content "as is" without warranty of any kind. We do not accept any responsibility or liability for the accuracy, content, images, videos, licenses, completeness, legality, or reliability of the information contained in this article. If you have any complaints or copyright issues related to this article, kindly contact the author above.
