
Last month marked the two-year anniversary of the American Rescue Plan Act’s (ARPA) passage, and with it, the $350 billion Coronavirus State and Local Fiscal Recovery Funds (SLFRF) program. Of that total, approximately $65 billion was allocated to large cities and counties with populations over 250,000—a group that we’ve monitored through the Local Government ARPA Investment Tracker, a joint research project from Brookings Metro, the National League of Cities (NLC), and the National Association of Counties (NACo).
The 331 city and county governments we’ve been tracking have now reported SLFRF spending data through the end of 2022. This post provides an update on these commitments, how the Department of the Treasury’s final rule on SLFRF spending has influenced local government strategies, and how city and county implementation of the program has evolved.
Large cities and counties committed three-quarters of their SLFRF dollars by December 2022
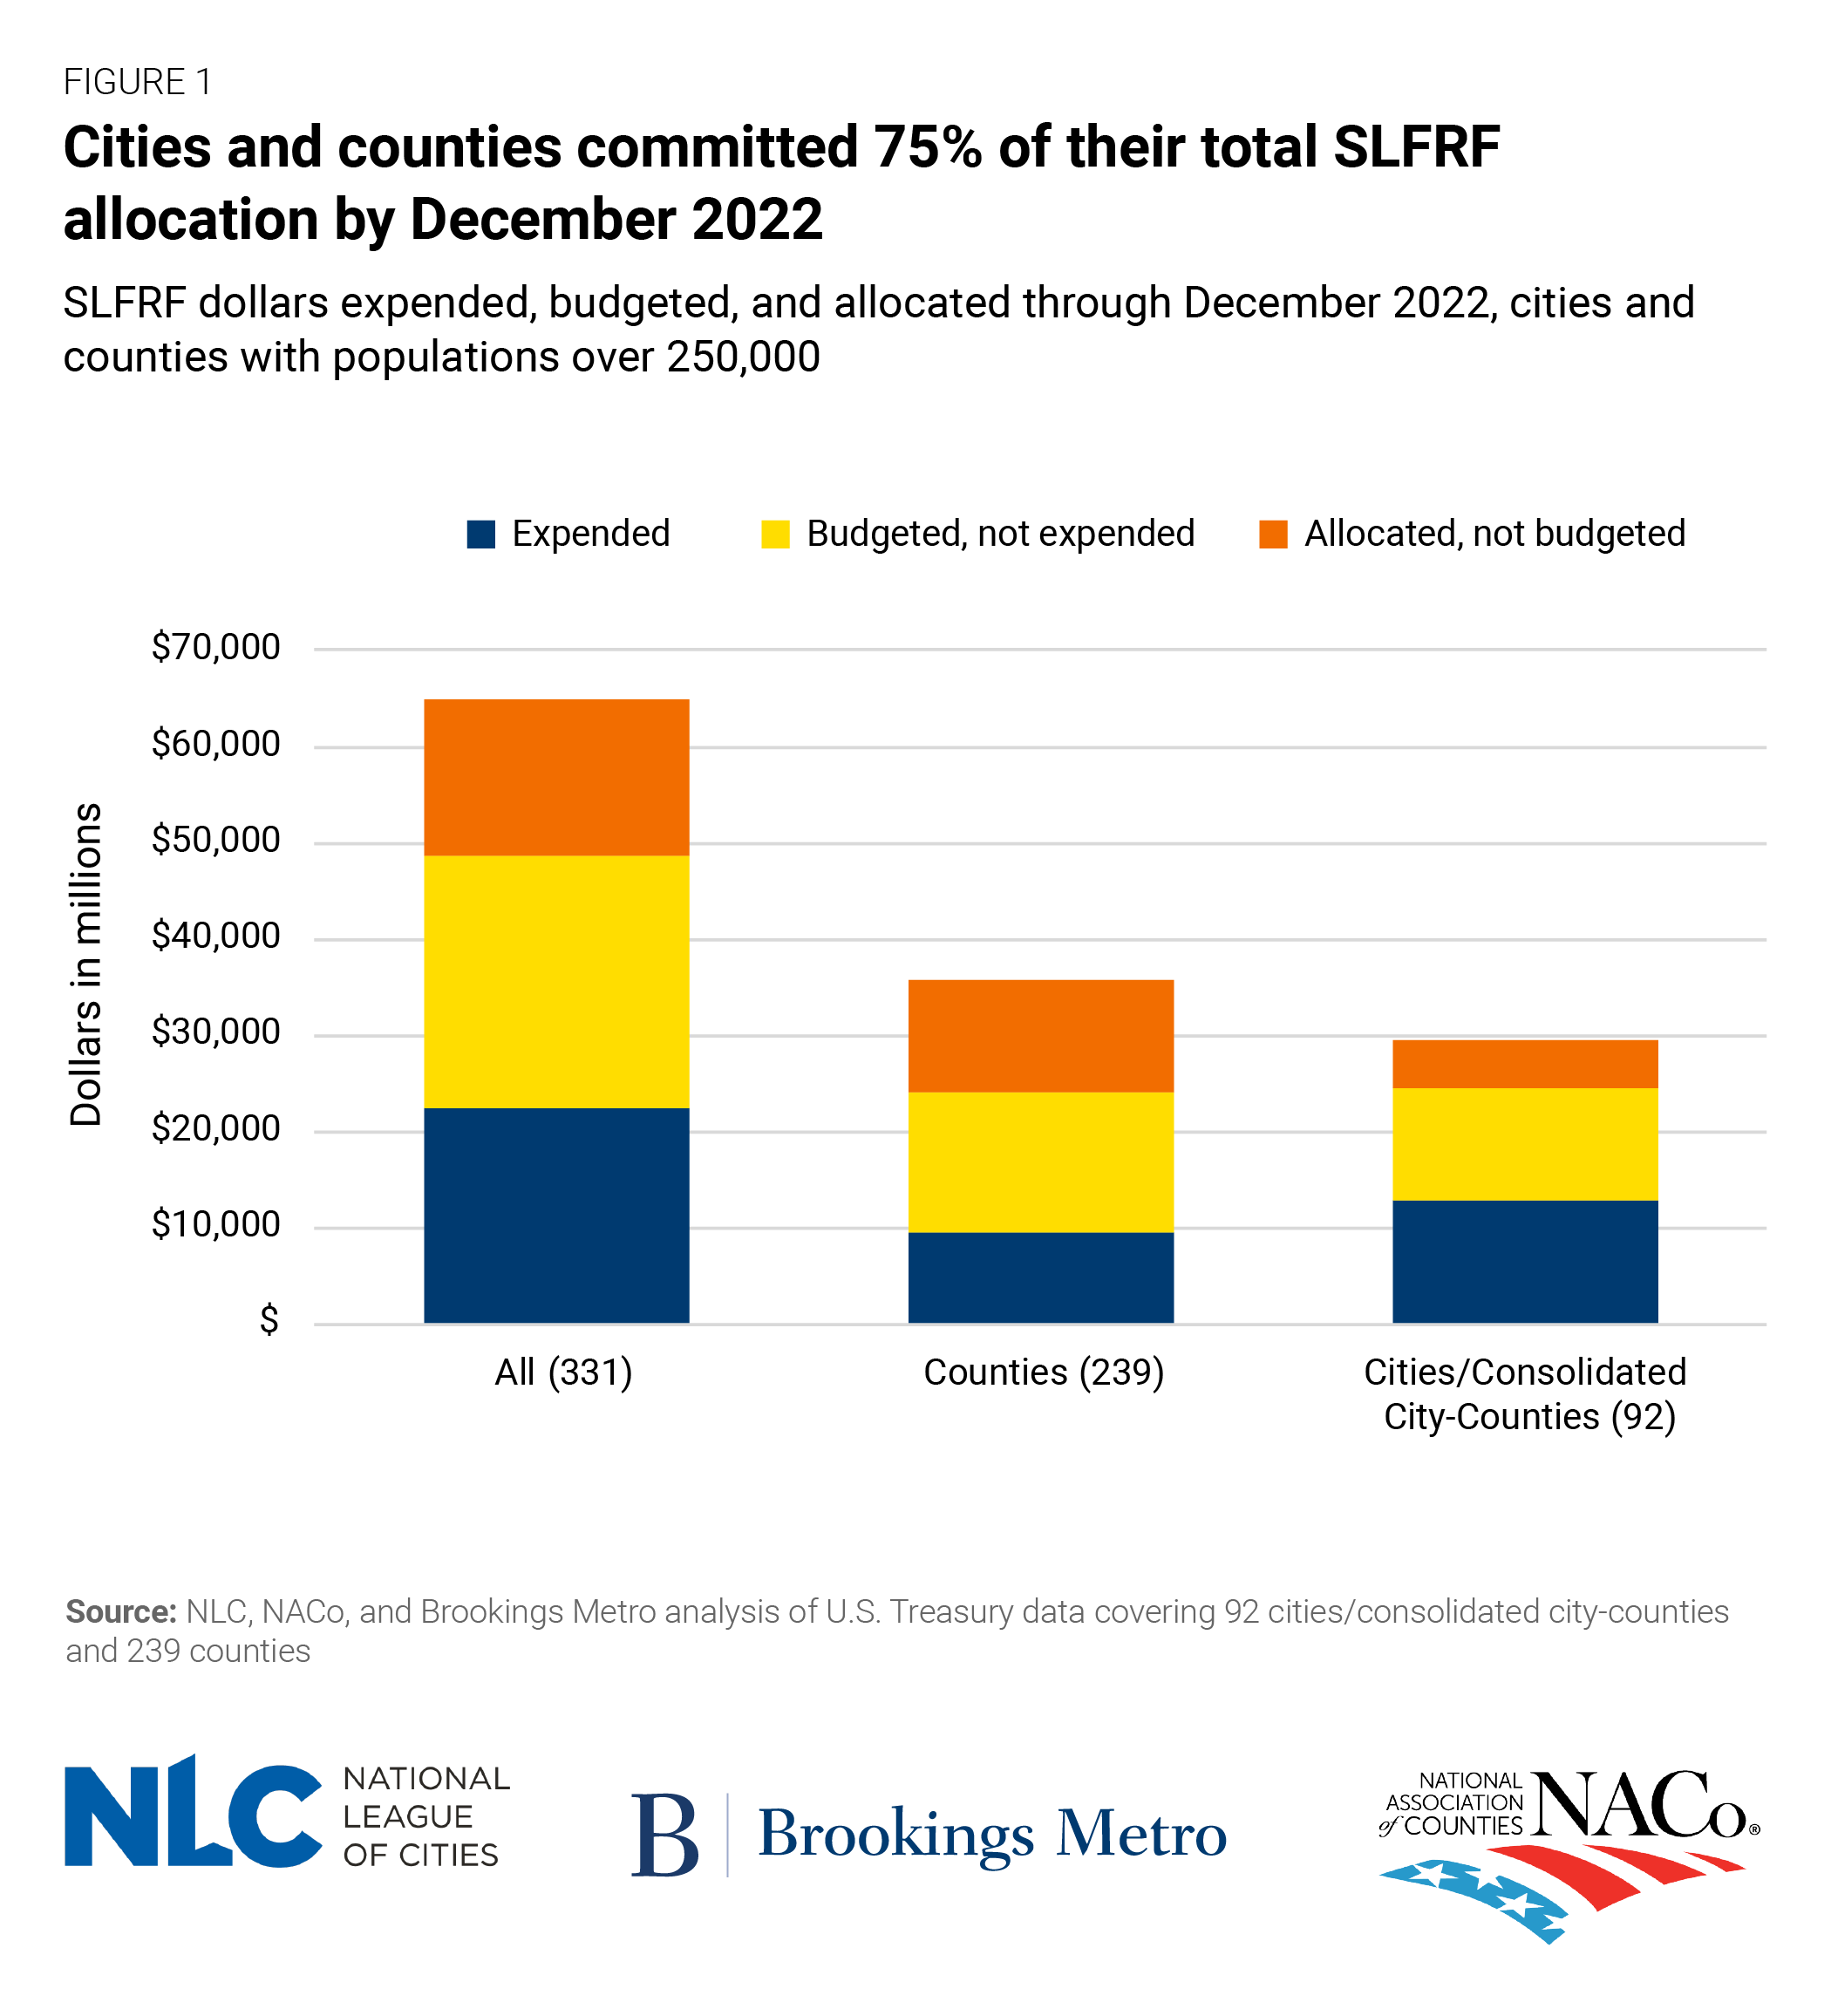
By the end of 2022, the large cities and counties we tracked had committed SLFRF dollars to 10,522 projects, compared to 8,825 projects at the end of September (a 19% increase). Over two-thirds of these projects were led by counties, which received 55% of the total SLFRF allocation issued to large local governments. Yet counties have committed a smaller share of their total SLFRF dollars than cities. By the end of December, counties had committed $24 billion (68%) of their SLFRF dollars, compared to the $25 billion (84%) committed by cities.
Overall, these 331 local governments committed $49 billion (75%) of their SLFRF dollars by the end of December—an increase of $4.6 billion (11%) over the previous quarter. Of these local governments, 71 (21%) have committed 100% of their total SLFRF appropriations.
Cities and counties appear to have finalized their SLFRF spending priorities
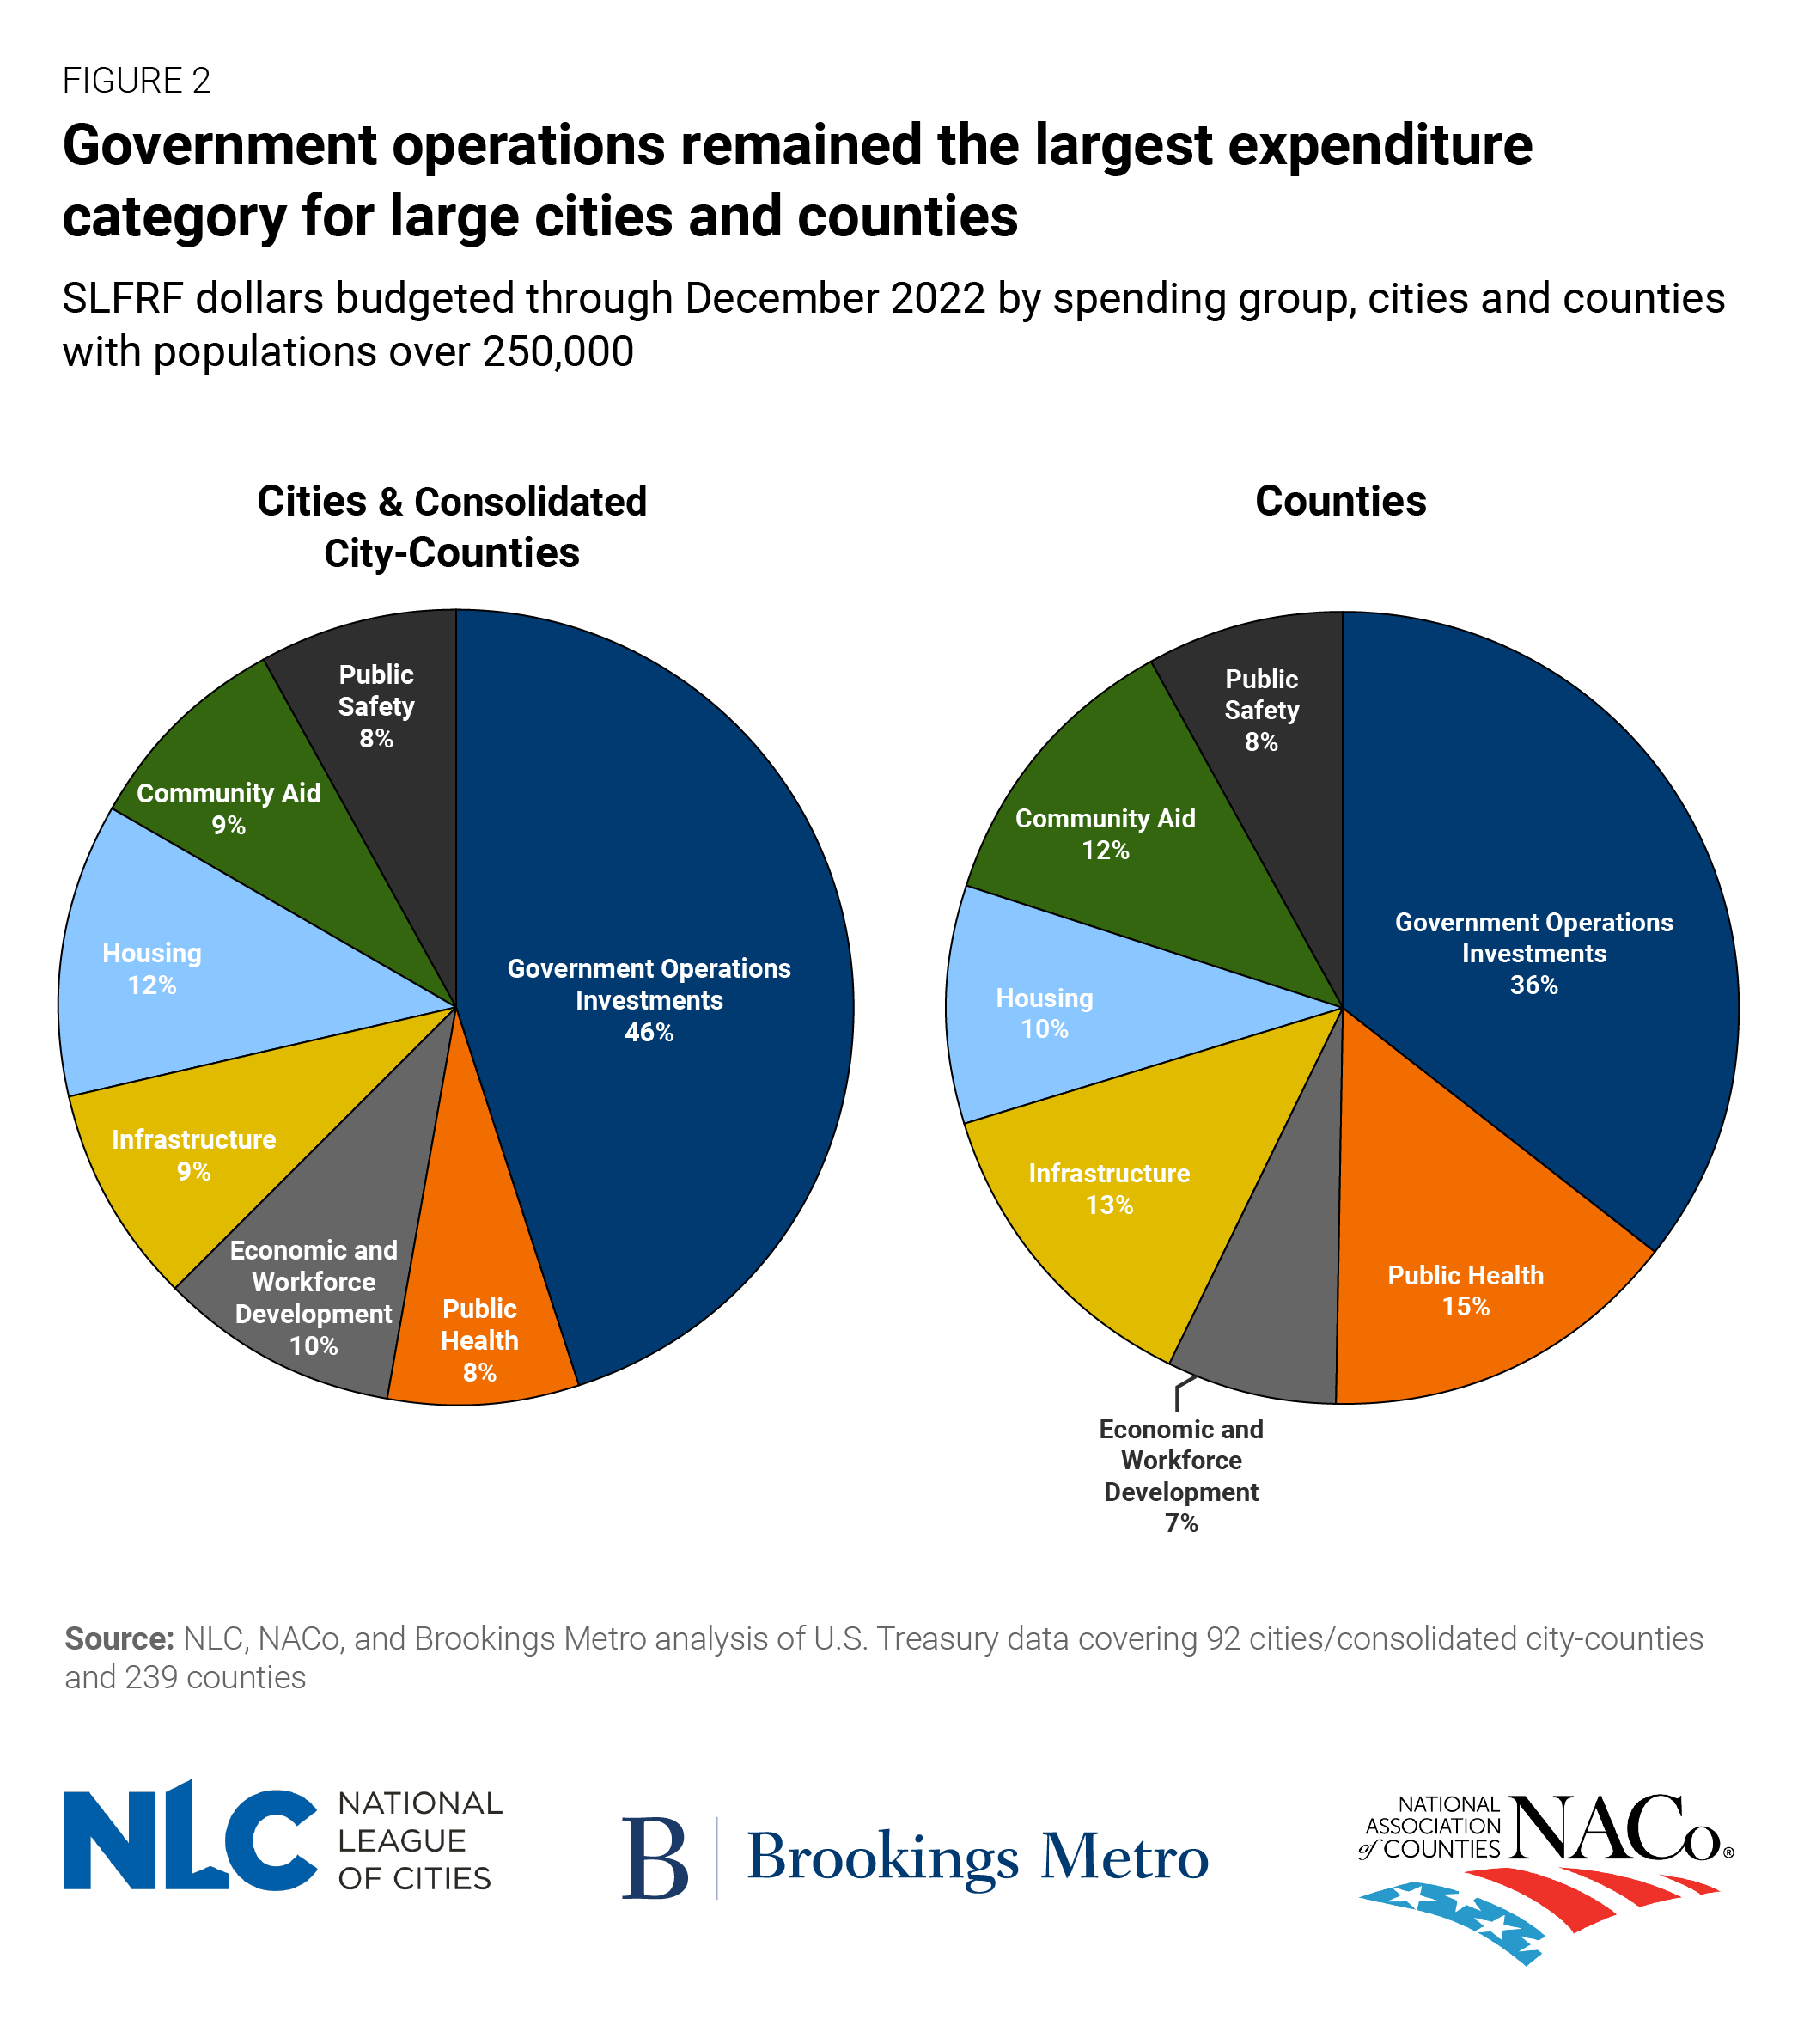
While the share of SLFRF allocations large cities and counties have committed continued to increase through December, spending priorities have remained relatively stable since mid-2022. Cities and counties continued to prioritize investments in government operations (41% of total commitments) through December, with most of those funds going toward fiscal health recovery and wages for public employees. These investments in government operations were slightly lower in counties (36%) than in cities (46%), as counties have assumed a larger role in administering ARPA-funded public health and capital infrastructure programs than other jurisdictions. However, county investments in government operations still outnumbered public health investments (the second-highest investment priority for counties) by more than a 2-to-1 ratio.
For most categories, cities and counties are spending SLFRF dollars at the same pace that they are committing them. However, funds appropriated to government operations investments continue to be spent at a faster rate than funds appropriated to other priority areas. In cities, 56% of spent dollars have gone toward government operations, compared to 46% of their total budget commitments. This trend holds for counties, where 48% of spent dollars have gone toward government operations, compared to 36% of their total budget commitments.
Investments in infrastructure have taken the longest to spend for both cities (where infrastructure investments make up 5% of expenditures and 9% of commitments) and counties (where infrastructure investments make up 4% of expenditures and 13% of commitments).
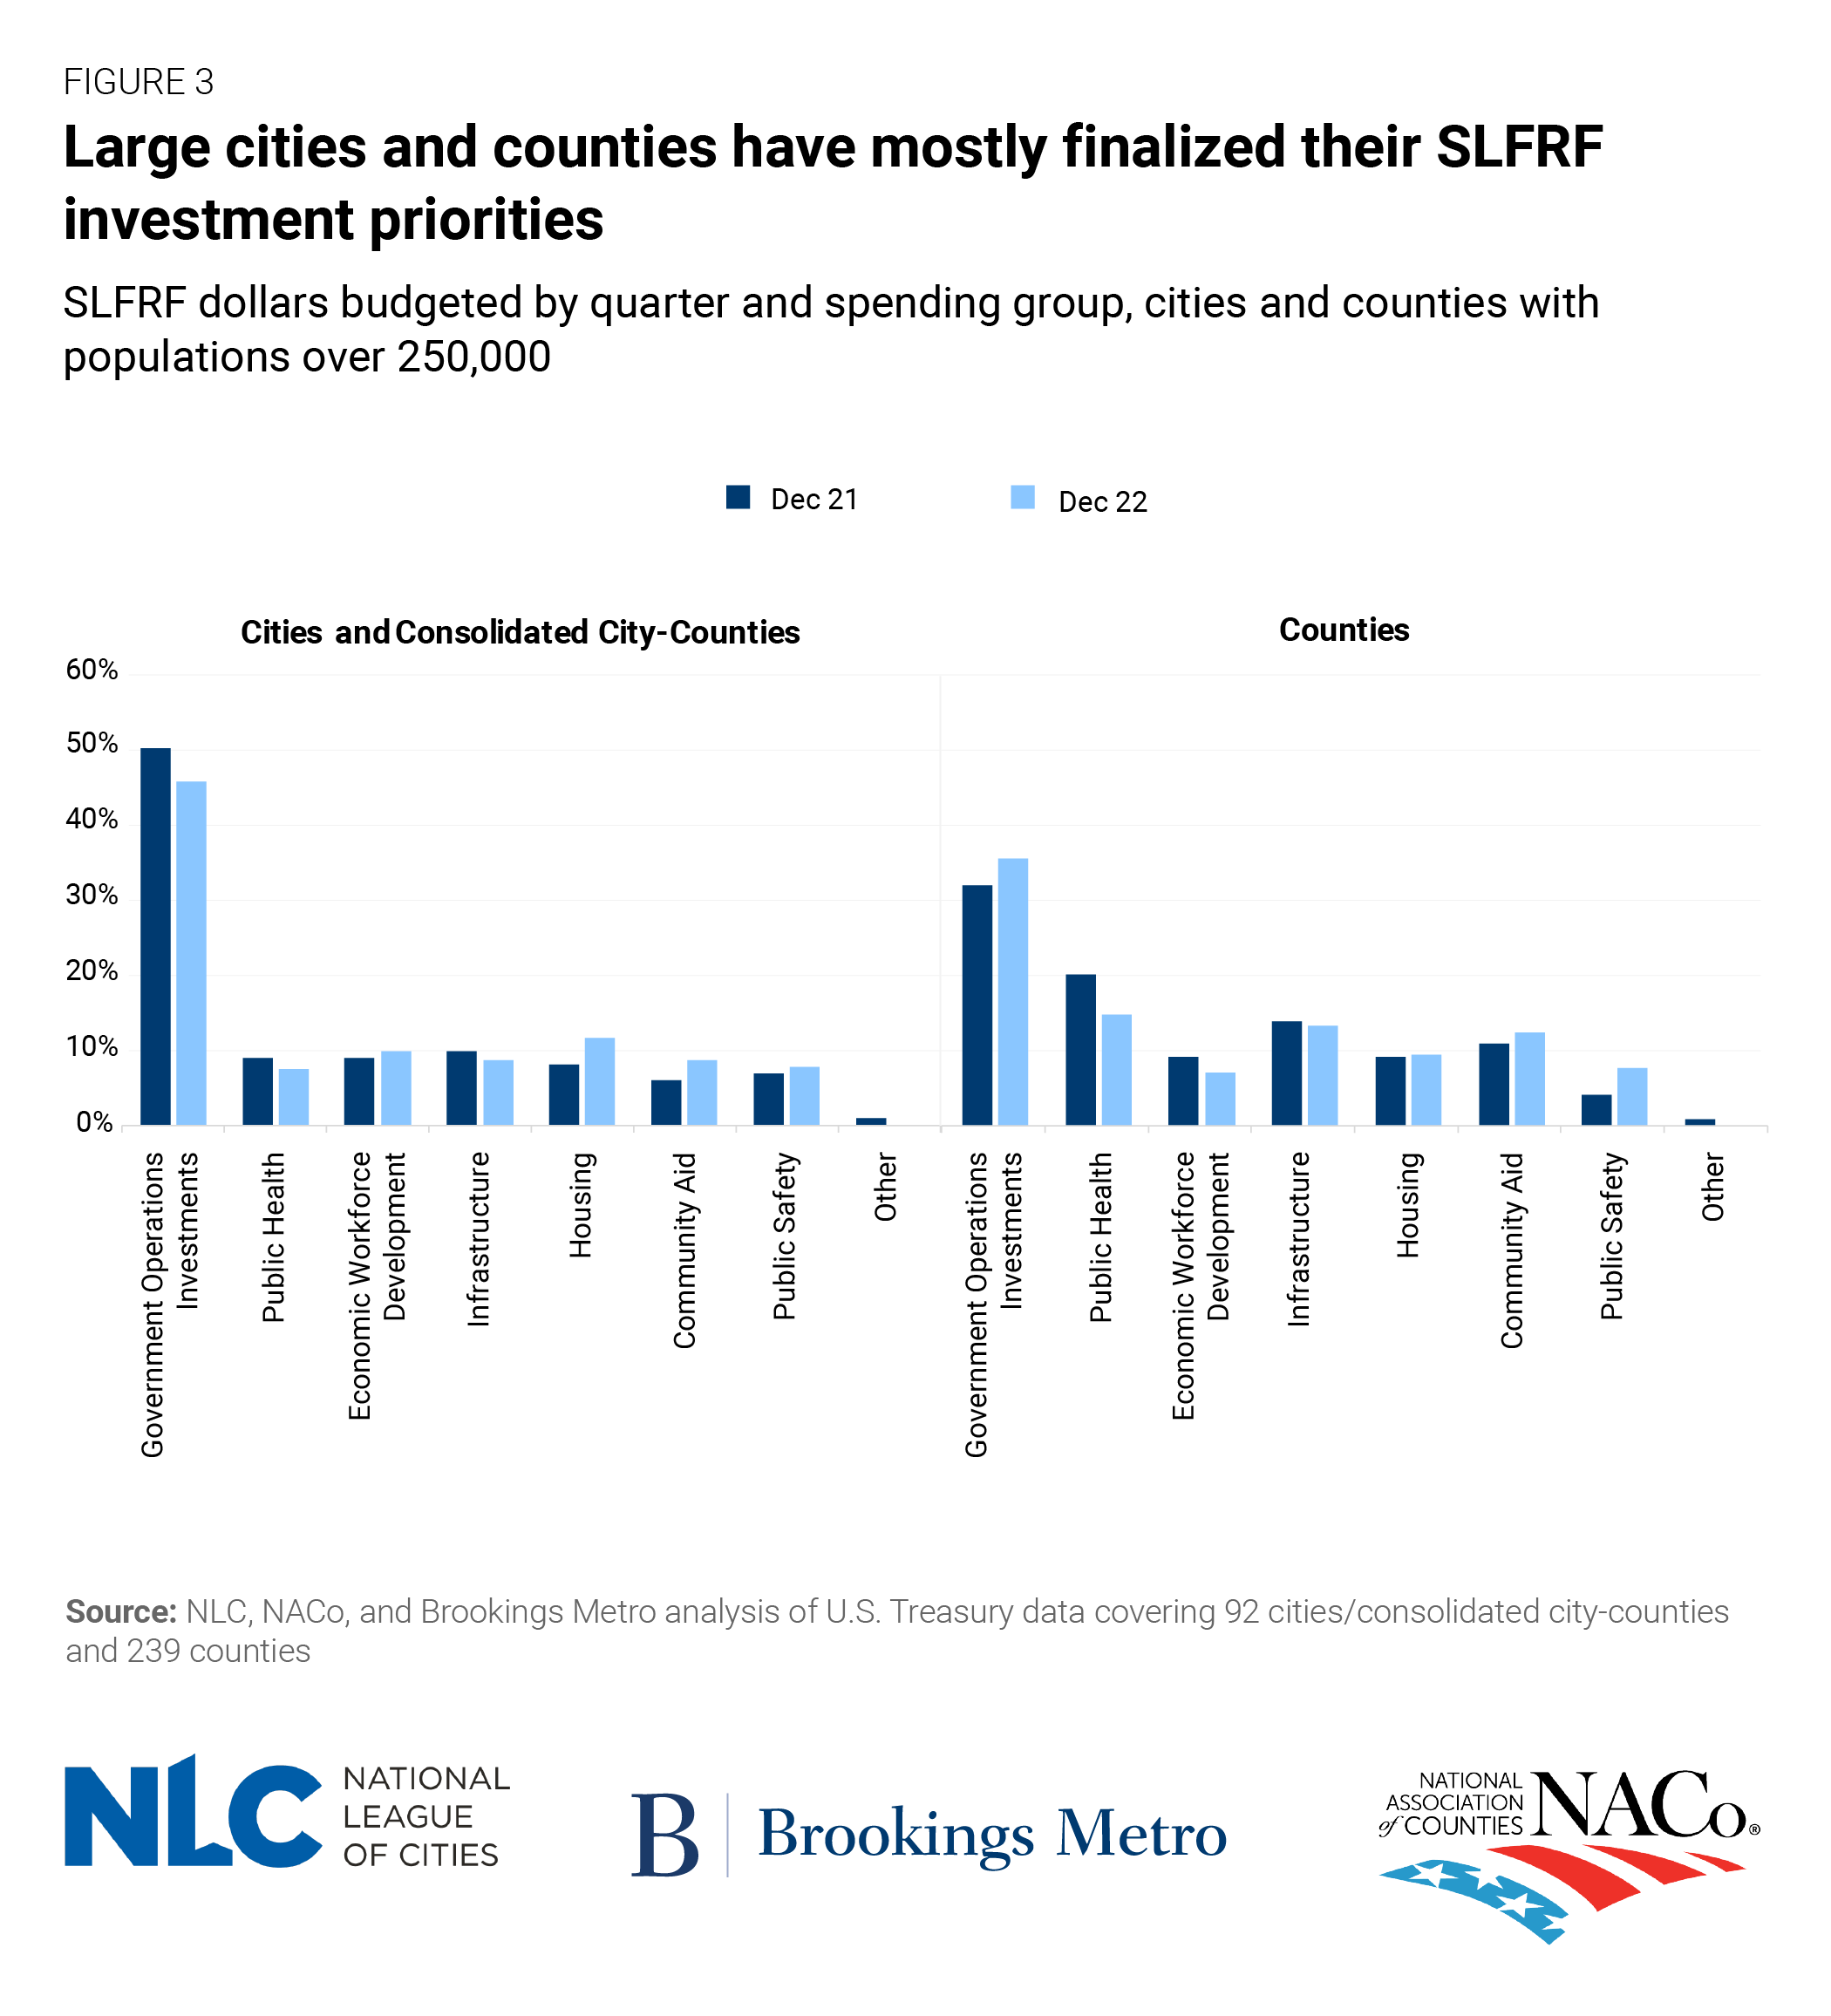
While there has been some variation across spending categories over time, large cities and counties have not substantially changed their investment strategies since mid-2022. Across cities, no investment category’s share of total ARPA commitments has shifted more than 2 percentage points over this period, or more than 4 percentage points since the end of 2021. While counties have shown slightly more variation, most of that fluctuation is attributable to minor changes in government operations and public health investments rather than any systematic change in priorities.
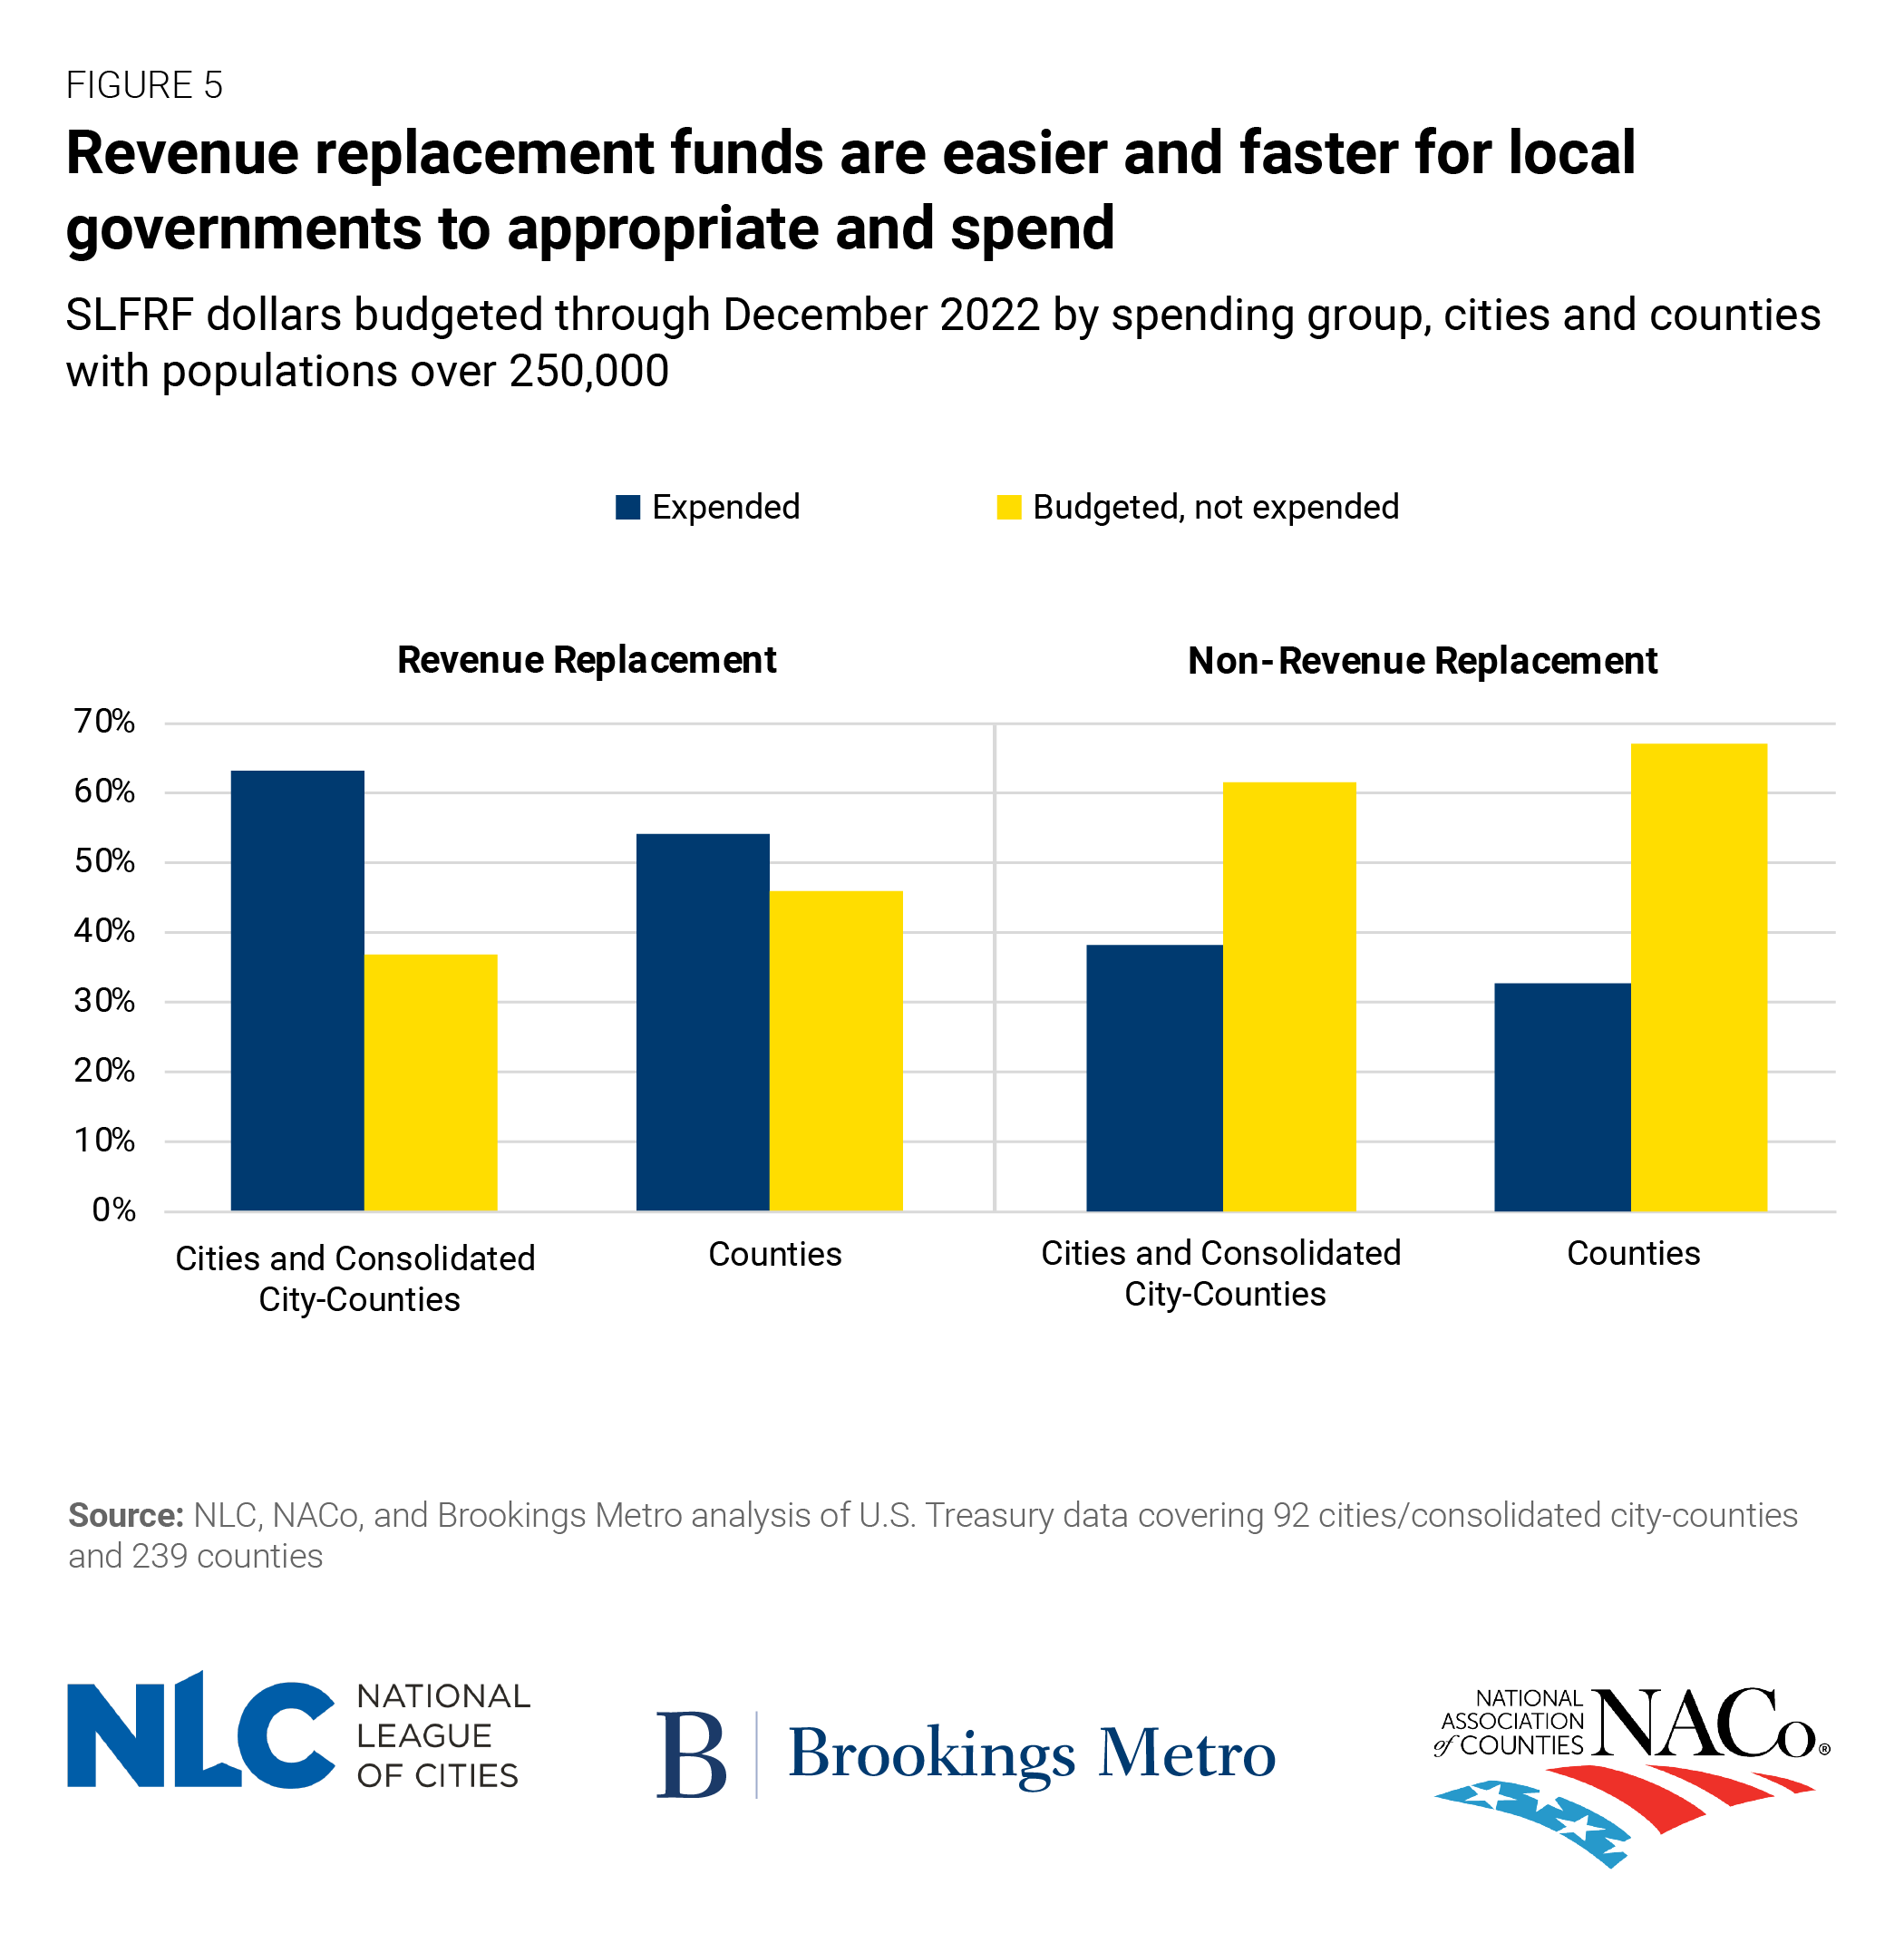
Treasury’s final rule has made some SLFRF dollars easier to spend
The SLFRF revenue loss provision—embedded in the final Treasury Department guidance issued in April 2022—is one reason why government operations account for such a large share of SLFRF commitments and expenditures. Through this provision, funds categorized as “revenue replacement” are exempt from most of ARPA’s reporting requirements and use restrictions. Though all local governments are permitted to categorize at least $10 million of their SLFRF allocation as revenue replacement, they are eligible to increase this amount if they can demonstrate that they lost more than that due to the COVID-19 pandemic.
While SLFRF rules explicitly classify revenue replacement as a permissible use, our Tracker looks more closely at city and county reporting to capture additional details that local governments provide for these funds. While many revenue replacement dollars are directed toward government operations as “fiscal health recovery” projects, others go toward local investments across the Tracker’s seven major budgetary categories.
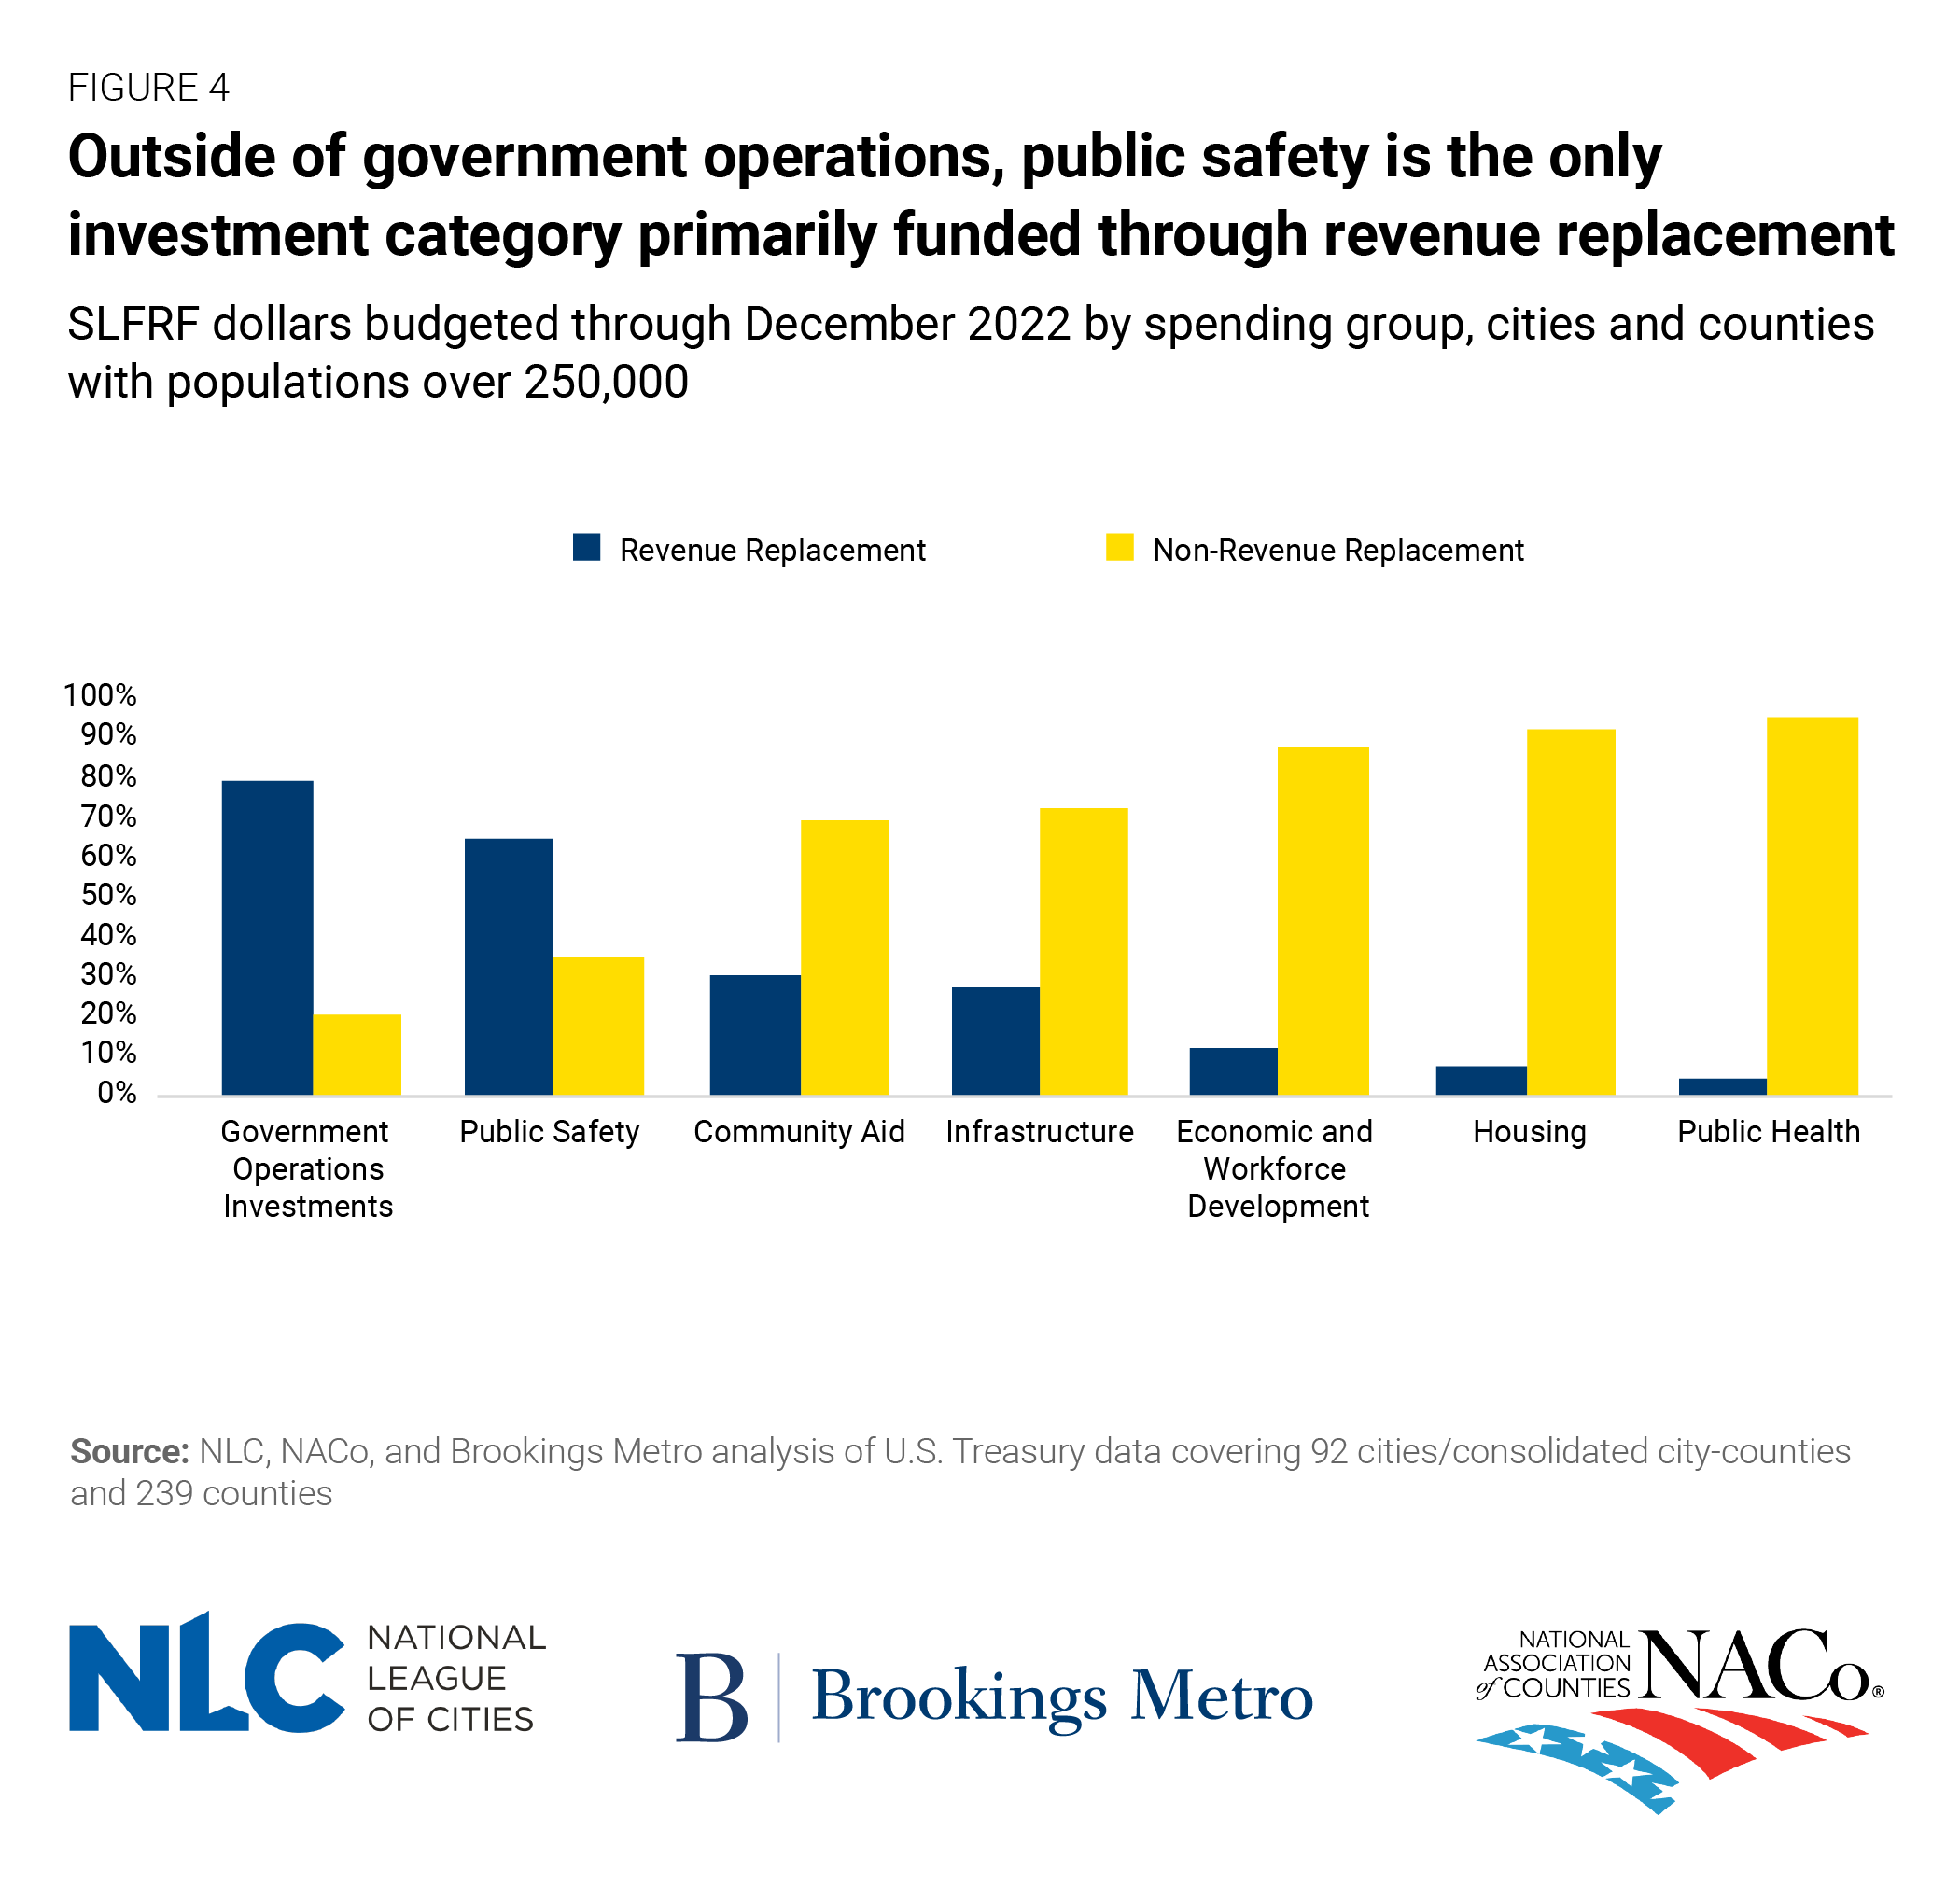
Outside of government operations, all investment categories received at least 70% of their funding from dollars not categorized as revenue replacement (except for public safety, including premium pay for public safety personnel, which was 65% funded through dollars categorized as revenue replacement). Across investment categories, local governments used revenue replacement dollars to expand civic capacity, support their overall recovery strategy, and fund projects that did not fit squarely into one of Treasury’s permissible use classifications. The decision to fund government operations primarily through revenue replacement dollars has allowed these commitments to outpace investment in every other major category by a factor of over 2-to-1 in every quarter.
The revenue loss provision is also a key reason why counties continue to lag cities in their budgeting and expenditure of SLFRF dollars. Because funds categorized as revenue replacement are free from many of the restrictions and reporting requirements that are attached to other SLFRF dollars, revenue replacement funds are easier to appropriate and spend. As of December 2022, 57% of funds budgeted by cities were classified as revenue replacement, compared to 35% by counties. While we do not fully know why cities and counties are utilizing the revenue loss provision differently, one potential explanation is that large cities rely on more volatile revenue sources than large counties, which led to cities experiencing a higher drop-off in revenue during the pandemic.
This latest batch of Treasury data reveals that local governments have not only accelerated their SLFRF commitments, but begun to crystallize their longer-term strategies for economic recovery. It also demonstrates how these cities and counties have used Treasury’s final rule to reduce administrative burdens and increase the flexibility of these funds. As cities and counties proceed through SLFRF’s implementation over the coming months and years, future rounds of reporting data will reveal how local governments continue to strike a balance between acute economic relief and bigger-picture investment priorities, as well as the extent to which federal guidance has influenced the way these programs are executed at the local level.
The authors thank Ricardo Aguilar, Christine Baker-Smith, Alan Berube, and Teryn Zmuda for research advice and support.
