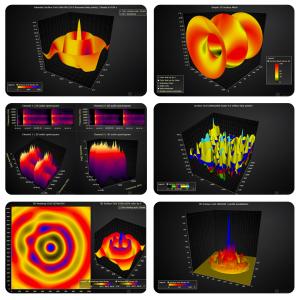
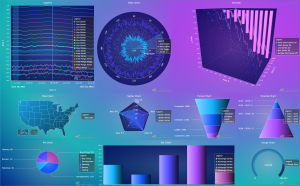
Finnish company releases the world's fastest data visualization library for JavaScript
LightningChart has specialized for the past 13 years in high-performance data visualization libraries. and their new JavaScript charting library is out now!
KUOPIO, FINLAND, December 14, 2021 /EINPresswire.com/ -- LightningChart has developed for more than a decade the most powerful data visualization libraries for .NET and JS that can be easily integrated within applications. Throughout the years, LightningChart, a company located in Finland, has focused on providing charting controls for the most demanding developers that need solutions other than limited open-source and low-performance JS libraries.Our latest release has been the JS cross-platform charting library v3.3.0 that includes breakthrough performance achievements and powerful charts oriented to fulfill requirements of applications targeting demanding industries such as science, motorsports, vibration analysis, or aerospace and defense.
The magic of the LightningChart JS data visualization library is due to the Web-GL rendered and fully GPU-accelerated charts that can handle incredibly large datasets. For instance, the latest performance comparisons demonstrated that LightningChart JS appending line charts are 516,000 times faster than average commercial and open-source libraries.
The boom of big data, data science, data analytics, and business intelligence has expanded the data management and processing capabilities and requirements of today’s applications. LightningChart is not the exception to this trend as of today, its JS library can visualize up to 1,225,000,000 (1.2 billion) data points in static heatmaps.
Processing such a high number of data points is key in specific industries that do not only need this amount of data points but also need to rely on fast rendering and low usage of CPU resources. In that case, what about CPU usage percentages? Do you need a supercomputer for such processes?
The short answer is not necessarily. For instance, when rendering appending line charts, an average non-hardware-accelerated charting library uses full CPU resources (100%) to intake only 100,000 data points per second.
Rendering 100,000 data points per second is a lot but when having to use all the device’s resources, that is simply not efficient!
Instead, LightningChart JS intakes 1 million data points per second at a CPU usage of 23.7%. That is, more than 75% of the CPU continues to be free to handle other processes. That’s a high-performance application.
At the end of November 2021, we have released the LightningChart JS library version 3.3.0 providing a big enhancement for all users whose applications require only the highest performance in data visualization and charting libraries for their applications.
Learn more about LightningChart JS.
Pasi Tuomainen
Arction Ltd.
+358 45 3150905
pasi.tuomainen@lightningchart.com
Visit us on social media:
LinkedIn
Twitter
Facebook
Other
World's Fastest JavaScript Data Visualization Library
Legal Disclaimer:
EIN Presswire provides this news content "as is" without warranty of any kind. We do not accept any responsibility or liability for the accuracy, content, images, videos, licenses, completeness, legality, or reliability of the information contained in this article. If you have any complaints or copyright issues related to this article, kindly contact the author above.


