
Dissolved Oxygen Increased, Heat and Rain Likely Contributors
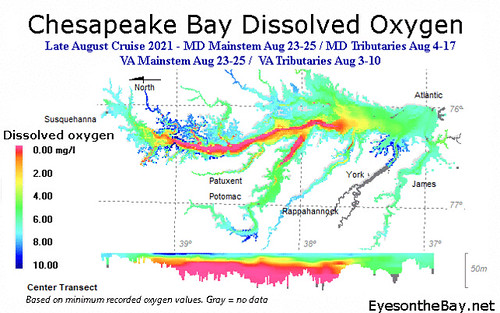
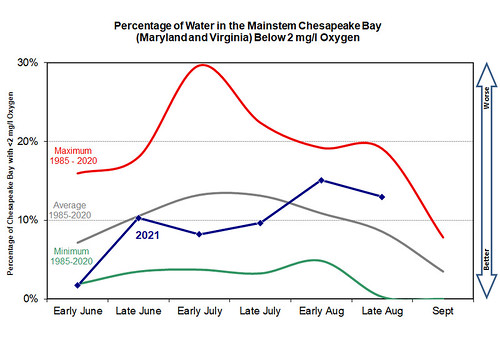 Data collected by the Maryland Department of Natural Resources (DNR) and Old Dominion University show that dissolved oxygen conditions in the Chesapeake Bay mainstem of Maryland and Virginia worsened in August following two better-than average months. The hypoxic water volume — areas with less than 2 mg/l oxygen — was 1.88 and 1.61 cubic miles during early and late August monitoring cruises, compared to historical early and late August averages (1985-2020) of 1.35 and 1.06 cubic miles.
Additionally, in early and late August, within the mainstem Bay’s hypoxic waters, 0.76 and 0.51 cubic miles were anoxic — zones with less than 0.2 mg/l oxygen.
 According to the National Oceanic and Atmospheric Administration’s National Centers for Environmental Information, this August was the third-warmest on record for Maryland, with lower-than-average wind speeds and greater-than-average precipitation. These factors likely contributed to worsening hypoxia as warmer waters hold less oxygen, less wind results in decreased mixing of oxygen into deeper waters, and higher freshwater flows into the Bay increase the stratification of the water column. This stratification, where less dense freshwater sits on top of denser saltier bottom waters, also inhibits mixing of oxygen into deeper water.
 Crabs, fish, oysters, and other creatures in the Chesapeake Bay require oxygen to survive. Scientists and natural resource managers study the volume and duration of Bay hypoxia to determine possible impacts to bay life.
Each year from June through September, DNR estimates hypoxic volumes in the bay using monitoring data collected by the State of Maryland and Virginia’s Department of Environmental Quality. Data collection is funded by these states and the U.S. Environmental Protection Agency’s Chesapeake Bay Program.
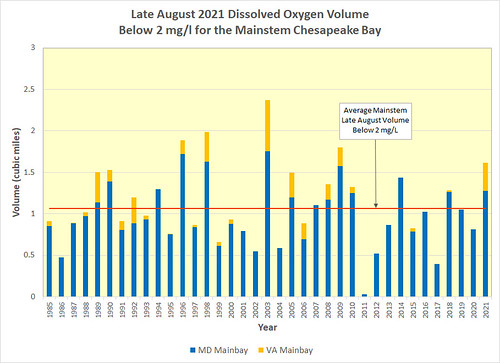 Beginning this year, combined results for Maryland and Virginia are being presented for the mainstem Bay, to be more comparable to the yearly seasonal forecast by the Chesapeake Bay Program, U.S. Geological Survey, University of Maryland Center for Environmental Science, and University of Michigan. The most recent forecast, released in late June 2021, expected Chesapeake Bay mainstem hypoxic volume to be 14% lower than the 35-year average due to reduced river flows from January through May 2021, as well as less nitrogen carried to the Bay because of nutrient management efforts.
Bay hypoxia monitoring and reporting will continue through September. More Maryland water quality data and information, including DNR’s hypoxic volume calculation methods, can be found at DNR’s Eyes on the Bay website.
