

K92 Mining Inc Announces Robust Kora Stage 3 Expansion PEA
VANCOUVER, British Columbia, July 27, 2020 (GLOBE NEWSWIRE) -- K92 Mining Inc. (“K92” or the “Company”) (TSX-V: KNT; OTCQX: KNTNF) is pleased to announce the results of the Preliminary Economic Assessment (“PEA”) on its Kora gold deposit (“Kora”), which together with its Irumafimpa gold deposit (“Irumafimpa”) comprise the Kainantu Gold Mine Project (the “Kainantu Project”) in Papua New Guinea. Based on the results of the study, the Company is proceeding to a Definitive Feasibility Study (“DFS”) for the Kora Stage 3 Expansion.
Stage 3 Expansion PEA Study Highlights
- After-tax NPV5% of US$1.5 billion at US$1,500 per ounce gold, increasing to an after-tax NPV5% of US$2.0 billion at US$1,900 per ounce gold.
- Average annual expansion run-rate production of 318,000 ounces gold equivalent (“AuEq”)(1) per annum at 1.0Mtpa, commencing in late-2023, representing a 165% increase from Stage 2 Expansion Life of Mine (“LOM”) average annual production.
- LOM average cash costs of US$353 per AuEq ounce and AISC(2) of US$489 per AuEq ounce.
- Low cash costs of US$202 per gold ounce and AISC costs of US$362 per gold ounce net of by-product credits.
- Initial pre-expansion capital cost of US$125 million and life of mine sustaining capital cost of US$341 million with all capital costs fully funded by existing Stage 2 Kainantu mine cash flow.
- Mine life of 12 years, including ~3 years of Stage 2 production (2021 to late-2023).
- AuEq – calculated on the following metal prices: Au – US$1,500/oz, Ag – US$18.00/oz, Cu – US$3.00/lb. Note that gold equivalence factors for the production estimates are different to those used for reporting the Mineral Resource estimate.
- AISC – All-In Sustaining Costs include cash costs plus estimated corporate G&A, sustaining costs and accretion.
The PEA is preliminary in nature and includes Inferred Mineral Resources that are considered too speculative geologically to have the economic considerations applied to them that would enable them to be categorized as Mineral Reserves, and there is no certainty that the PEA will be realized. Mineral Resources that are not Mineral Reserves do not have demonstrated economic viability.
John Lewins, K92 Chief Executive Officer and Director, stated, “Over the past three years, Kainantu has delivered tremendous production and exploration growth and we are very pleased to report the results for the next major growth plan - Stage 3 Expansion. The PEA economics are robust, with run-rate production of ~318,000 oz AuEq per annum; low average all-in sustaining costs net of by-product credits of $362/oz gold which benefitted from higher copper grades and economies of scale, and; an after-tax NPV5% of US$1.5 billion at US$1,500/oz. Importantly, the Stage 3 Expansion is a low capital intensity project and within our ability to self-fund from scheduled mine cash flow.
As a result, we are initiating a Definitive Feasibility Study (“DFS”) for Stage 3, targeting mid-2021. Work on the new twin incline is underway and we currently have four diamond drill rigs operational underground focused on upgrading the resource for the DFS and expanding the known resource to the south and at depth. Surface exploration is also rapidly expanding, from the current 3 diamond drill rigs to 5 drill rigs by year-end, adding even greater focus on resource growth near-mine and regionally.”
PEA Overview
The Kora Stage 3 Expansion PEA considers an expansion to underground mining with on-site treatment of mine material by conventional milling, gravity and flotation recovery through a standalone 1-million-tonne-per annum (“Mtpa”) process plant. The PEA is derived from the Company’s Mineral Resource Estimate for Kora (effective date of April 2, 2020) and does not incorporate post resource drilling results.
An updated technical report prepared in accordance with National Instrument 43-101 – Standards of Disclosure for Mineral Projects (“NI 43-101”), titled, “NI 43-101 Independent Technical Report and Preliminary Economic Assessment for Expansion of the Kainantu Project to treat 1 Mtpa from the Kora Gold Deposit, Kainantu, Papua New Guinea”, which will include the results of the PEA discussed in this news release together with an updated Mineral Resource Estimate for the Kora Deposit, will be filed on SEDAR at www.sedar.com under the Company’s profile by July 31, 2020.
Table 1: Kainantu Stage 3 Expansion - Preliminary Economic Assessment Highlights
| US Dollars unless otherwise stated |
Life of Mine (starting January 2021) |
Post Stage 3 Completion (2024 onwards) |
| Production | ||
| Mine life (years) | 12 years | |
| Total mill feed (000s tonnes) | 9,788 | |
| Average mill throughput (tonnes per annum) | 816 ktpa | 1.0 Mtpa (run-rate)(1) |
| Total Metal Production | ||
| AuEq (000s ounces) | 3,096 | 2,639 |
| Gold (000s ounces) | 2,642 | 2,229 |
| Copper (mlbs) | 195 | 177 |
| Silver (000s ounces) | 4,248 | 3,833 |
| Average Annual Metal Production | ||
| AuEq (000s ounces per annum) | 258 | 318 (run-rate)(1) |
| Gold (000s ounces per annum) | 220 | 270 (run-rate)(1) |
| Copper (mlbs per annum) | 16 | 21 (run-rate)(1) |
| Silver (000s ounces per annum) | 354 | 450 (run-rate)(1) |
| Average Grade | ||
| AuEq grade (g/t) | 10.4 g/t | |
| Gold grade (g/t) | 8.84 g/t | |
| Copper grade (%) | 1.0% | |
| Silver grade (g/t) | 18 g/t | |
| Average Recovery | ||
| Gold Recovery (%) | 95% | |
| Copper Recovery (%) | 95% | |
| Silver Recovery (%) | 77% | |
| Costs | ||
| Mining cost per tonne (US$/t) | $41.41 | $40.18 |
| Processing cost per tonne (US$/t) | $25.20 | $24.77 |
| G&A cost per tonne (US$/t) | $27.01 | $23.84 |
| Total operating cost per tonne of mill feed (US$/t) | $93.62 | $88.79 |
| Sustaining capital per tonne of mill feed (US$/t) | $34.63 | $24.84 |
| Total cost per tonne of mill feed (US$/t) | $128.26 | $113.63 |
| Initial pre-expansion capital expenditure ($m) | $125 | |
| Sustaining capital expenditure ($m) | $341 | |
| Total capital expenditure ($m) | $466 | |
| Cash cost per ounce AuEq ($/oz)(2) All-in sustaining cost per ounce AuEq ($/oz)(3) Cash cost per ounce gold ($/oz)(2) |
$353 $489 $202 |
$341 $445 $177 |
| All-in sustaining cost per ounce gold ($/oz)(3) | $362 | $301 |
| Base Case Economic Analysis at US$1,500/oz Gold, US$3.00/lb Copper and US$18.00/oz Silver | ||
| After-tax NPV0% | $2.0 billion | |
| After-tax NPV5% | $1.5 billion | |
| IRR (%) and Payback Period (years) | N/A (Self-Funded) | |
| Economic Analysis at $1,900/oz Gold, US$3.00/lb Copper and US$18.00/oz Silver | ||
| After-tax NPV0% | $2.7 billion | |
| After-tax NPV5% | $2.0 billion | |
| IRR (%) and Payback Period (years) | N/A (Self-Funded) |
- Run-rate excludes the final partial calendar year of production
- Cash costs are net of by-product credits and are inclusive of mining costs, processing costs, site G&A and refining charges and royalties.
- AISC includes cash costs plus estimated corporate G&A, sustaining costs and accretion.
Kora Mineral Resource Estimate
The Company’s current Mineral Resource Estimate for Kora (effective date of April 2, 2020) was completed by H & S Consultants Pty. Ltd. (Table 2). The Kora resource estimate provides the resource base for the PEA, while the Irumafimpa deposit was not included in the PEA.
Table 2 – Global Kora Mineral Resource (Effective Date April 2, 2020, 1 g/t gold cut-off)
| Tonnes | Gold | Copper | Copper | AuEq | |||||
| (Mt) | (g/t) | (Moz) | (g/t) | (Moz) | (%) | (kt) | (g/t) | (Moz) | |
| Measured | 0.66 | 13.34 | 0.28 | 11.6 | 0.25 | 0.51 | 3.4 | 14.14 | 0.3 |
| Indicated | 2.47 | 8.44 | 0.67 | 16.3 | 1.29 | 0.63 | 15.6 | 9.46 | 0.8 |
| Total M&I | 3.13 | 9.47 | 0.95 | 15.3 | 1.54 | 0.61 | 19 | 10.45 | 1.1 |
| Inferred | 12.67 | 7.32 | 2.98 | 19.9 | 8.11 | 1.1 | 139.4 | 9.01 | 3.7 |
- The Independent and Qualified Person responsible for the Mineral Resource Estimate is Simon Tear, P.Geo. of H & S Consultants Pty. Ltd., Sydney, Australia.
- Mineral Resources are not Mineral Reserves and do not have demonstrated economic viability.
- Resources were compiled at 1,2,3,4,5,6,7,8,9 and 10 g/t gold cut-off grades.
- Density (t/m3) is on a per zone basis, K1 and Kora Link: 2.84 t/m3; K2: 2.93 t/m3; Waste: 2.8 t/m3.
- Reported tonnage and grade figures are rounded from raw estimates to reflect the order of accuracy of the estimate.
- Minor variations may occur during the addition of rounded numbers.
- Calculations used metric units (metres, tonnes and g/t).
- Gold equivalents are calculated as AuEq = Au g/t + ((0.923 x Cu%)*1.38)+ ((0.77 x Ag g/t*0.0115). Gold price US$1,400/oz; Silver US$16.05/oz; Copper US$3.05/lb. Metal payabilities and recoveries are incorporated into the AuEq formula. Recoveries of 92.3% for copper and 77% for silver.
- Note that these gold equivalence factors for resource reporting are different to those applied for the mine plan and production estimates.
Mining Operations
The Company engaged Australian Mine and Development Pty. Ltd. (“AMDAD”) to undertake the PEA mine plan for Kora, which involved:
- Applying financial and processing parameters to determine cut-off grades for stope design.
- Generating three-dimensional stope shapes and mining inventory using the CAE Mineable Shape Optimiser (MSO) program.
- Creating a conceptual development layout to suit the MSO inventory.
- Producing a project cash-flow model based on a mining schedule prepared by a third party consultant engaged by K92.
The Stage 3 Expansion mine plan is designed as an incline access operation with a series of ore passes for efficient gravity material movement amongst sublevels and ultimately to the twin incline for material transport to surface. Life of mine tonnage from the PEA mine plan is approximately 80% from long hole open stoping and 20% from cut and fill mining methods. Both mining methods have already been successfully applied at the Kora deposit, with long hole stoping utilizing the AVOCA and modified AVOCA methods. The AVOCA methods involve backfilling from the overcut sublevel while the long hole stope is advanced from the undercut sublevel to limit the strike length of the open stope. By limiting the strike length of the open stope the method is designed to maintain stability of the stope walls and backs and increase the ultimate strike length extracted. The application of cut and fill mining is greatest during the earlier parts of the mine plan until the paste fill plant is constructed in 2022. Prior to the implementation of the paste fill plant, fill is exclusively unconsolidated waste backfill. Once the paste fill plant is commissioned, the AVOCA method will be replaced by longhole stoping with cemented fill.
Stopes were identified for the mine plan based on the CAE Mineable Shape Optimiser (MSO) program at an elevated cut-off grade of 5.5 g/t AuEq. An elevated cut-off grade was selected as this provided the greatest discounted cash flow while resulting in only a moderate reduction in gold equivalent ounces produced. Stope shapes with uneconomic development access were excluded. Dilution was estimated based on a 0.5m dilution skin for both the footwall and hanging wall using the MSO program for a minimum stope width of 3.0 metres. An additional dilution factor of 8% (12% for K1) was then applied to account for external dilution from backfill and additional falloff. The overall dilution range is 21% to 41%, with K1 and K2 averaging 31% and 26% dilution, respectively. A simple mining recovery factor of 90% was applied. The life of mine average head grade is 8.84 g/t Au, 1.0 % Cu and 18 g/t Ag or 10.4 g/t AuEq.
The mine plan involves operating at the Stage 2 400,000-tonnes-per-annum throughput rate until late-2023 when the Stage 3 Expansion is online. In 2024 to the end of the mine life, the designed throughput rate is 1 Mtpa. See Table 5 for a material movement summary as part of the simplified economic model.
See Figure 1 for a long-section of the life of mine plan lateral and vertical development.
See Figure 2 for the Mineable Shape Optimiser (MSO) shapes at 5.5g/t AuEq cut-off long-section.
Mineral Processing, Tailings and Infrastructure
K92 engaged Mincore Pty. Ltd. to complete the PEA for the expansion of Kainantu through the design of a standalone 1 Mtpa processing plant and supporting infrastructure. The new plant is adjacent to the existing process plant, which has a designed throughput of 400,000 tonnes per annum. The existing plant will be placed on care and maintenance upon the ramp-up of the Stage 3 Process Plant.
Run-of-mine (ROM) material is trucked ~6km from the 800 Portal to the Kainantu Process Plant, where it is either stockpiled or direct tipped. The 1 Mtpa processing plant design flowsheet incorporates a conventional single stage jaw crushing (200tph) with direct feed SAG milling circuit (125tph), mill that includes flash flotation and a gravity circuit to capture free gold to produce gold dore, followed by conventional sulphide flotation, thickening, filtering and drying for concentrate. This circuit is based on simple conventional technology, with the flow-sheet largely similar to the existing Kainantu processing circuit. The key differences being the Stage 3 Process Plant implementing one-stage crush circuit (vs two-stage crushing circuit) and SAG milling (vs ball milling).
Tailings management upgrades are part of the Stage 3 Expansion, through the construction of a paste fill plant to mitigate surface tailings deposition. Thickened tailings at the process plant are designed to be pumped to the paste fill plant at the 800 Portal, with the final paste fill product pumped underground to void stopes for fill. Residual thickened tailings report to the tailings impoundment on surface. To support the increased processing capacity and implementation of the paste fill plant, a new 13MW centralized standby power station will be constructed, in addition to 22kV switchyard and 11kV substation, 11kV power reticulation and 11kV overhead power line to the 800 Portal.
See Figure 3 for the 1.0Mtpa Process Plant Flowsheet.
See Figure 4 for the location of the 1.0Mtpa Standalone Processing Plant.
Capital and Operating Costs
The initial capital cost estimate includes an overall 25% contingency and the major items are outlined in Table 3.
Table 3: Capital Cost Estimates
| US Dollars unless otherwise stated | |
| Camp Upgrade | $4.1m |
| Process Plant 1Mtpa | $46.3m |
| Power Station | $16.0m |
| Office Facilities | $0.8m |
| Mining Fleet | $25.9m |
| Paste fill Plant & Electricals | $20.3m |
| Freight | $11.3m |
| Initial Pre-Expansion Capital | $124.6m |
| Total Life of Mine Sustaining Capital | $341.3m |
Totals may differ due to rounding
Table 4: Operating Cost Estimates (Life of Mine Average)
| US Dollars unless otherwise stated | ||
| Mining Cost ($/t) | $41.41 | |
| Processing Cost ($/t) | $25.20 | |
| G&A Cost ($/t) | $27.01 | |
| Total Cost Per Tonne Processed ($/t) | $93.62 | |
| Totals may differ due to rounding | ||
Economic Analysis
In addition to preparation of mine plan schedules, AMDAD prepared a pre-tax conceptual cashflow and discounted cashflow derived from the schedule. Tax calculations for the after-tax cashflow and discounted cashflow were prepared by K92. A summary is shown in Table 5 and a sensitivity analysis to gold price is shown in Table 6.
Table 5: Simplified Financial Model at US$1,500/oz Au, US$3.00/lb Cu, US$18.00/oz Ag
| Year | 2021 | 2022 | 2023 | 2024 | 2025 | 2026 | 2027 | 2028 | 2029 | 2030 | 2031 | 2032 |
| Mill Throughput (ktpa) | 396 | 401 | 542 | 872 | 985 | 1,002 | 1,004 | 992 | 1,001 | 1,000 | 1,000 | 593 |
| Gold Grade | 10.97 | 10.77 | 9.02 | 7.38 | 9.50 | 9.12 | 10.17 | 9.24 | 8.57 | 9.20 | 8.65 | 3.71 |
| Copper Grade | 0.56% | 0.57% | 0.78% | 0.91% | 0.93% | 0.85% | 0.82% | 1.17% | 1.15% | 1.16% | 1.06% | 0.89% |
| Silver Grade | 11.4 | 12.0 | 13.8 | 13.7 | 17.7 | 17.4 | 16.3 | 18.1 | 23.9 | 20.5 | 19.9 | 15.8 |
| AuEq Grade | 11.88 | 11.71 | 10.28 | 8.80 | 10.99 | 10.50 | 11.50 | 11.08 | 10.43 | 11.03 | 10.33 | 5.10 |
| Gold Production (000s oz) | 133 | 132 | 149 | 197 | 286 | 279 | 312 | 280 | 262 | 281 | 264 | 67 |
| Copper Production (m lbs) | 4.6 | 4.8 | 8.9 | 16.6 | 19.2 | 17.8 | 17.2 | 24.4 | 24.0 | 24.3 | 22.2 | 11.0 |
| Silver Production (000s oz) | 111 | 119 | 185 | 296 | 433 | 432 | 405 | 445 | 592 | 507 | 493 | 232 |
| AuEq Production (000s oz) | 144 | 143 | 170 | 234 | 331 | 321 | 353 | 336 | 319 | 337 | 315 | 92 |
| Net Revenue (US$m)(1) | $198 | $198 | $233 | $320 | $454 | $441 | $485 | $458 | $434 | $460 | $432 | $124 |
| Total OPEX (US$m)(1) | $50 | $54 | $62 | $82 | $88 | $90 | $90 | $86 | $87 | $90 | $87 | $50 |
| Growth Capital (US$m) | $18 | $39 | $54 | $11 | $3 | $0 | $0 | $0 | $0 | $0 | $0 | $0 |
| Sustaining Capital (US$m) | $44 | $43 | $42 | $32 | $34 | $38 | $27 | $25 | $24 | $14 | $10 | $6 |
| Pre-Tax Net Cashflow (US$m) | $86 | $62 | $76 | $196 | $329 | $313 | $367 | $348 | $323 | $356 | $334 | $68 |
| After-tax Net Cashflow (US$m) | $54 | $35 | $45 | $144 | $238 | $222 | $261 | $247 | $229 | $254 | $238 | $52 |
| 1. Net revenue in summary model includes the impact of royalty payments. | ||||||||||||
Table 6: After-Tax NPV5% Sensitivity to Gold Price
| Gold Price | After-Tax NPV5% (US$B) | |
| $1,400 | $1.3 billion | |
| $1,500 | $1.5 billion | |
| $1,600 | $1.6 billion | |
| $1,700 | $1.7 billion | |
| $1,800 | $1.8 billion | |
| $1,900 | $2.0 billion | |
Conference Call and Webcast to Present Results
K92 will host a conference call and webcast to present the Stage 3 Kainantu Expansion PEA at 8:30 am (EDT) on Tuesday, July 28, 2020.
- Listeners may access the conference call by dialing toll-free to 1-800-319-4610 within North America or +1-604-638-5340 from international locations.
° The conference call will also be broadcast live (webcast) and may be accessed via the following link: http://services.choruscall.ca/links/k92mining20200728.html
Qualified Person
K92 Mine Geology Manager and Mine Exploration Manager, Mr. Andrew Kohler, PGeo, a Qualified Person under the meaning of NI 43-101 has reviewed and approved the technical content of this news release. Data verification by Mr. Kohler includes significant time onsite reviewing drill core, face sampling, underground workings and discussing work programs and results with geology and mining personnel.
On Behalf of the Company,
John Lewins, Chief Executive Officer and Director
For further information, please contact David Medilek, P.Eng., CFA at +1-604-687-7130.
NEITHER TSX VENTURE EXCHANGE NOR ITS REGULATION SERVICES PROVIDER (AS THAT TERM IS DEFINED IN POLICIES OF THE TSX VENTURE EXCHANGE) ACCEPTS RESPONSIBILITY FOR THE ADEQUACY OR ACCURACY OF THIS RELEASE.
Non-GAAP Financial Measures
In this press release, we use the terms “cash costs" and "all-in sustaining costs ". These should be considered as non-GAAP financial measures as defined in applicable Canadian securities laws and should not be considered in isolation or as a substitute for measures of performance prepared in accordance with GAAP.
Cash costs per ounce is a non-GAAP term typically used by gold mining companies to assess the level of gross margin available to the Company by subtracting these costs from the unit price realized during the period. This non-GAAP term is also used to assess the ability of a mining company to generate cash flow from operations. Cash costs per ounce includes mining and processing costs plus applicable royalties, and net of by-product revenue and net realizable value adjustments. Total cash costs per ounce is exclusive of exploration costs.
Cash costs per ounce is intended to provide additional information only and does not have any standardized meaning under IFRS and may not be comparable to similar measures presented by other mining companies. It should not be considered in isolation or as a substitute for measures of performance prepared in accordance with IFRS. The measure is not necessarily indicative of cash flow from operations under IFRS or operating costs presented under IFRS.
The Company adopted an "all-in sustaining costs per ounce" non-GAAP performance measure in accordance with the World Gold Council published in June 2013. The Company believes the measure more fully defines the total costs associated with producing gold; however, this performance measure has no standardized meaning. Accordingly, there may be some variation in the method of computation of "all-in sustaining costs " as determined by the Company compared with other mining companies. In this context, "all-in sustaining costs" for the consolidated Company reflects total mining and processing costs, corporate and administrative costs, exploration costs, sustaining capital, and other operating costs.
All-in sustaining costs per gold ounce is intended to provide additional information only and does not have any standardized meaning under IFRS and may not be comparable to similar measures presented by other mining companies. It should not be considered in isolation or as a substitute for measures of performance prepared in accordance with IFRS.
CAUTIONARY STATEMENT REGARDING FORWARD-LOOKING INFORMATION: This news release includes certain “forward-looking statements” under applicable Canadian securities legislation. Forward-looking statements are necessarily based upon a number of estimates and assumptions that, while considered reasonable, are subject to known and unknown risks, uncertainties, and other factors which may cause the actual results and future events to differ materially from those expressed or implied by such forward-looking statements. All statements that address future plans, activities, events, or developments that the Company believes, expects or anticipates will or may occur are forward-looking information, including statements regarding the realization of the preliminary economic analysis for the Kainantu Project, expectations of future cash flows, the planned plant expansion, production results, cost of sales, sales of production, potential expansion of resources and the generation of further drilling results which may or may not occur. Forward-looking statements and information contained herein are based on certain factors and assumptions regarding, among other things, the market price of the Company’s securities, metal prices, exchange rates, taxation, the estimation, timing and amount of future exploration and development, capital and operating costs, the availability of financing, the receipt of regulatory approvals, environmental risks, title disputes, failure of plant, equipment or processes to operate as anticipated, accidents, labour disputes, claims and limitations on insurance coverage and other risks of the mining industry, changes in national and local government regulation of mining operations in PNG, mitigation of the Covid-19 pandemic, continuation of the lifted state of emergency, and regulations and other matters. There can be no assurance that such statements will prove to be accurate, as actual results and future events could differ materially from those anticipated in such statements. Accordingly, readers should not place undue reliance on forward-looking statements. The Company disclaims any intention or obligation to update or revise any forward-looking statements, whether as a result of new information, future events or otherwise, except as required by law.
Figure 1 – Kainantu life of mine plan lateral and vertical development (looking West) is available at https://www.globenewswire.com/NewsRoom/AttachmentNg/cc583aad-e763-4835-b8be-c8c8239c91ec
Note: RAR: Return Airway, FAR: Fresh Airway; OP: Ore Pass
Figure 2 – Mineable Shape Optimiser (MSO) shapes at 5.5g/t AuEq cut-off long-section (looking West) is available at https://www.globenewswire.com/NewsRoom/AttachmentNg/cb64fe62-8887-4c8f-b0e6-5e47af9b9c0f
Figure 3 – 1.0Mtpa Process Plant Flowsheet is available at https://www.globenewswire.com/NewsRoom/AttachmentNg/4b377027-9f1a-498e-9e0f-a20d1887ebf3
Figure 4 – Plan View of Standalone and Existing Processing Plants is available at https://www.globenewswire.com/NewsRoom/AttachmentNg/8196abf4-71d8-40b3-855a-f181b3b060de

Figure 1
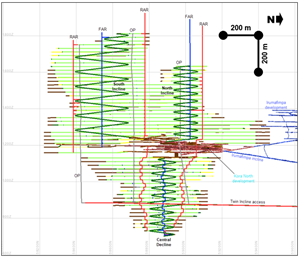
Kainantu life of mine plan lateral and vertical development (looking West)
Figure 2
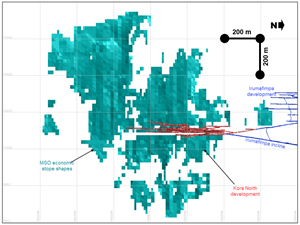
Mineable Shape Optimiser (MSO) shapes at 5.5g/t AuEq cut-off long-section (looking West)
Figure 3
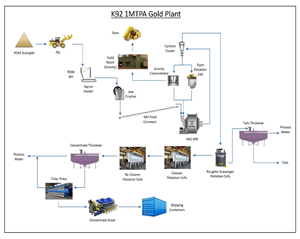
1.0Mtpa Process Plant Flowsheet
Figure 4
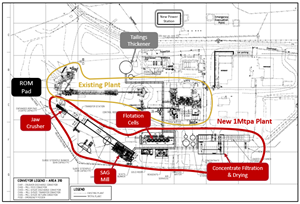
Plan View of Standalone and Existing Processing Plants
Legal Disclaimer:
EIN Presswire provides this news content "as is" without warranty of any kind. We do not accept any responsibility or liability for the accuracy, content, images, videos, licenses, completeness, legality, or reliability of the information contained in this article. If you have any complaints or copyright issues related to this article, kindly contact the author above.
