
Teranga Gold Announces Positive Pre-Feasibility Study Results for Top-Tier Sabodala-Massawa Gold Complex
Sabodala-Massawa
- First 5-year average annual production of 384,000 ounces at all-in sustaining costs of $671/oz(1)(2)
- First 5-year average net cash flow of $215 million per year at $1,600/oz gold*
- First 5-year total net cash flow of $1.1 billion at $1,600/oz gold*
- Proven and probable reserves increase 120% to 4.8 million ounces at $1,250/oz gold
- Mining activities at Massawa now underway
- $10-million exploration and drill program is ongoing at Massawa
Company-Wide
- Proven and probable reserves increase by 70% to 6.4 million ounces of gold
- Average annual gold production expected to increase by 40% to ~500,000 ounces(3)
(All amounts are in U.S. dollars unless otherwise stated)
TORONTO, July 26, 2020 (GLOBE NEWSWIRE) -- Teranga Gold Corporation ("Teranga" or the "Company") (TSX: TGZ) (OTCQX: TGCDF) is pleased to announce the results of its preliminary feasibility study (the “PFS”) for the Sabodala-Massawa Gold Complex (“Sabodala-Massawa”), located in Senegal, West Africa.
Earlier this year, Teranga completed the acquisition of the Massawa gold project (the “Massawa Project”), one of Africa’s highest grade undeveloped open-pit gold projects, from Barrick Gold Corporation (“Barrick”). The PFS focuses on an initial concept to mine the Massawa Project’s deposits leveraging the existing plant at Teranga’s flagship Sabodala Gold Operations (“Sabodala”).
The PFS demonstrates that Sabodala-Massawa is a top-tier mine with a large proven and probable reserve (“2P Reserves”) base of 4.8 million ounces (75.79 Mt at 1.98 g/t Au at $1,250 gold), with low all-in-sustaining costs (“AISC”)(1)(2) of $749 per ounce, and net cash flows of over $2.2 billion* at $1,600/oz gold over a 16.5-year mine life. In addition, the PFS outlines the strong potential for growth through further exploration and discovery.
Sabodala-Massawa: Base Case Highlights at $1,600/oz Gold
(Includes refractory ore treatment plant in 2023)
|
First 5-years (2021-2025) |
First 10-years (2021-2030) |
Life of Mine (2020-2036) |
||||
| Annual average gold production(4) | 384,000 oz | 315,000 oz | 260,000 oz | |||
| Average mill grade | 2.71 g/t | 2.26 g/t | 1.98 g/t | |||
| Average AISC per ounce(1)(2) | $671 | $715 | $749 | |||
| Average annual plant throughput | 5.0Mtpa | 4.9Mtpa | 4.6Mtpa | |||
| Average annual net cash flow(2)* | $215 million | $166 million | $134 million | |||
| Total net cash flow* | $1.07 billion | $1.66 billion | $2.21 billion | |||
*Net cash flow after minority interest
“The PFS announced today confirms that the Massawa acquisition is truly transformational for Teranga and repositions the Company as a leading mid-tier gold producer with one of the lowest all-in sustaining cost profiles in the industry,” stated Richard Young, President and CEO.
Mr. Young continued, “The integration of Sabodala and Massawa is perhaps the best example in mining of the ‘greater than the sum of its parts’ concept. The sum of Massawa, one of the highest grade open-pit deposits in Africa, and our flagship Sabodala mine is more than simply adding one large gold reserve to another. Integrating Sabodala and Massawa yields significant synergies, with the combined entity expected to generate net cash flows of $1 billion(2)* over the first five years and deliver a net present value of $1.6 billion(2) compared to less than a billion dollars for the two assets on a standalone basis.”
Project Return Sensitivity Analysis(2)
| Gold Price | $/oz | $ | 1,500 | $ | 1,600 | $ | 1,700 | $ | 1,800 |
| After-tax NPV0% | $ millions | $ | 2,133 | $ | 2,438 | $ | 2,742 | $ | 3,046 |
| After-tax NPV5% | $ millions | $ | 1,550 | $ | 1,777 | $ | 2,004 | $ | 2,231 |
| After-tax after minority interest NPV0% | $ millions | $ | 1,936 | $ | 2,210 | $ | 2,484 | $ | 2,758 |
| After-tax after minority interest NPV5% | $ millions | $ | 1,416 | $ | 1,622 | $ | 1,827 | $ | 2,033 |
Now that a base case technical concept has been established with the PFS, Teranga will continue the technical work in support of a definitive feasibility study (“DFS”), anticipated to be completed in 2021, to further de-risk and increase the Massawa Project’s value. Management believes that the current capital estimate is conservative and leaves room for engineering trade-off studies to optimize areas such as mill sizing, power distribution and process design, while the current drill program is expected to result in an increase in mineral resources and reserves.
Teranga expects to file a technical report pursuant to National Instrument 43-101 – Standards of Disclosure for Mineral Projects (“the NI 43-101”) in respect of the PFS on the Sabodala-Massawa complex on or before August 31, 2020. A DFS, anticipated in 2021, will include further trade-off studies for the process flowsheet to potentially reduce capital and improve project economics, as well as focus on unlocking additional value through exploration drilling. An updated mineral resources and reserves estimate is expected to be included in the DFS based on results from the Company’s significant exploration program currently underway at the Massawa Project.
“Bringing the Massawa and Sabodala projects together builds on and amplifies the strengths of the two assets – infrastructure is largely in place, labour and contractors are trained and available, and exploration and mine investments can be better leveraged over a longer period of time,” stated Paul Chawrun, Chief Operating Officer.
Mr. Chawrun added, “Building a separate processing stream for the refractory ores will add higher than anticipated capital costs but offers many advantages throughout the life of mine. Early processing of high-grade refractory ore enhances project economics, increases production, reduces processing risks and improves operating flexibility. Furthermore, we believe in the great potential of this project and are conducting an aggressive drilling campaign for both refractory and free-milling ore, with a goal to sustain Sabodala-Massawa’s gold production between 350,000-400,000 ounces per year beyond 2026.”(5)
Exploration Upside at Massawa Project
The Massawa Project is comprised of a mine license of 320 km2 and a regional exploration land package of nearly 286 km2. The opportunity for additional resource delineation on the property is well known to Teranga and the previous owner Randgold Resources Limited, which merged with Barrick in 2019. Teranga has drilled more than 27,000 metres since March 2020 at Massawa, as part of an ongoing $10-million exploration program. Exploration drilling programs are ongoing at the three initial primary deposits – Sofia, Central Zone (“CZ”) and North Zone (“NZ”), with along-trend and internal drilling gaps being evaluated.
In addition to the compelling resource expansion targets within or immediately along trend of the three primary deposits, considerable opportunity exists to explore and add refractory and non-refractory resources elsewhere within the Massawa Project area. There are several satellite deposits and prospects, which have only been subject to shallow drilling, all of which show potential for additional mineralization at depth that can be added into the overall project resources, regardless of whether they are refractory or non-refractory mineralized bodies. Examples of such satellite deposits and prospects that will be aggressively explored in preparation of the DFS and beyond include Tina, Delya and Samina.
Additionally, a number of prospects will be pursued along a structural corridor that exists between two major regional structures. These include the Bakkan Corridor and Bambaraya prospects. The Company anticipates that a comprehensive exploration program across the entirety of this broad area, bounded by the two regional structures within the Massawa Project area, holds significant potential for the long-term addition of resources for the project.
Significant Synergies Expected from Mining Sabodala-Massawa
The existing mine operating fleet currently used at Sabodala will also be used for the combined Sabodala-Massawa deposits, applying an integrated mine sequencing plan to optimise the combined 2P Reserves base. The ability to use the existing long-haul ore contractor, mining mobile fleet, and operating team provides significant value to the combined project, as identified with the synergies outlined at the time of the acquisition.
Metallurgy and Processing
Phase 1: Free-Milling or Non-Refractory Whole Ore Leach (“WOL”)
Mined non-refractory ore will be processed in the existing Sabodala processing plant. Modifications are in progress to increase the capability for overall gold production and increase efficiencies to process the high-grade oxide ore at CZ. These additions include a gravity recovery circuit for the coarse gold, an additional leach tank to increase residence time, and upgrades to the elution circuits due to the higher gold content in the feed. These upgrades are expected to be installed throughout the first half of 2021 as “Phase 1” of the Sabodala plant upgrades.
Phase 2: Refractory Ore Treatment (“ROT”)
For processing the deposits that contain refractory gold ore, a separate ROT plant with a nominal capacity of 1.2 Mtpa will be installed adjacent to the existing Sabodala plant, with processing expected to begin in 2023. The ROT design is based on the use of bacterial oxidation (“BIOX® technology”) to expose the gold that is occluded within sulphide minerals, which then allows for gold extraction using a standard CIL process. This technology is well proven and is currently operating in multiple plants around the world.
Sabodala’s existing plant will be modified to allow primary crushing of the refractory ore feed with the existing crushing circuit, prior to feeding into a separate circuit comprising grinding, flotation to recover sulphides and free gold to a concentrate, regrinding, followed by oxidation of the slurry in two stages of BIOX reactors. The slurry product is then neutralized and processed in a separate carbon-in-leach (“CIL”) circuit to recover the gold.
The Company expects to modify its existing tailings storage facility (“TSF”) and the design of its second permitted TSF to accommodate the processing of refractory ores.
Industry-Leading Operating Costs Expected at Sabodala-Massawa
Operating costs(2) include all direct costs for the production of gold doré. The estimates are based on annual rates determined in the mining schedule with ore delivery from the Sabodala and Massawa Project pits.
Mine operating costs(2) were determined using the current Sabodala fleet and personnel assumptions, with incremental costs included for the expanded footprint, additional ore haul and additional dewatering costs for some of the Massawa Project pit areas.
Processing costs(2) are based on current operating plant assumptions, metallurgical test results, quotations from suppliers in the existing price environment and consultant recommendations. For WOL processing, the throughput rate is expected to average 4 Mtpa. For ROT processing throughput, a rate of 1.2 Mtpa was estimated based on the PFS design criteria.
| Unit | LOM average cost | |
| Mining(2) | $/tonne mined | 2.56 |
| WOL processing(2) | $/tonne milled | 10.23 |
| ROT processing(2) | $/tonne milled | 36.07 |
| General & Admin(2) | $/tonne milled | 4.00 |
General and administrative costs(2) consist of site office costs, insurance, financial costs (banking charges, legal fees, etc.), refining and transportation costs and personnel costs.
Life of Mine Capital Costs
Life of mine sustaining capital(2) for Sabodala-Massawa total $241 million, which equates to approximately $15 million per annum, and includes mobile fleet upgrades and replacements, road construction, TSF lifts, and general sustaining capital in support of mining, processing and general and administrative functions.
Life of mine development capital(2) for Sabodala-Massawa totals $409 million. Massawa Project phase 1 totals $37 million and phase 2 totals $219 million. The balance of development capital is for the Sabodala village relocation as well as underground development, not scheduled until 2027 under the current LOM (see tables in the Appendix for more detail).
Q3 2020 Milestones
Teranga has recently accessed the Sofia deposit, the first of the Massawa deposits to be mined, mining operations have begun, and processing the Massawa Project’s free-milling high-grade ore through Sabodala’s existing operating plant is scheduled to begin shortly.
Other milestones this quarter include:
- filing the Sabodala-Massawa NI 43-101 technical report;
- a revised life of mine production schedule for the Wahgnion gold mine, where the plant is exceeding initial performance expectations;
- updated company-wide production and costs guidance for 2020, as well as new five-year (2021-2025) production and cost guidance;
- technical report for the Golden Hill property; and
- exploration results from the Massawa Project and Afema.
Conference Call & Webcast Details
Teranga will host a conference call and audio webcast on July 27, 2020, at 8:30 a.m. (ET) to discuss the PFS in more detail. Those wishing to listen can access the live conference call and webcast as follows:
| Date & Time: | Monday, July 27, 2020 at 8:30 a.m. ET | |
| Telephone: | Toll-free +1-877-291-4570 | |
| Local or International +1-647-788-4919 | ||
| Please allow 10 minutes to be connected to the conference call. | ||
| Webcast: | Available on Teranga’s website at www.terangagold.com/Sabodala-MassawaPFS | |
| Replay: | The conference call replay will be accessible for two weeks after the call by dialling +1-416-621-4642 or toll-free at +1-800-585-8367 and entering the conference ID 8870643. | |
| Note: | The slide presentation will be available for download at www.terangagold.com for simultaneous viewing during the call. | |
Teranga Competent and Qualified Persons Statement
The PFS was prepared by technical consultants and Teranga Qualified Persons (“QPs”) (as defined under NI 43-101). Technical consultant QPs are independent of Teranga and have reviewed and approved the information in this press release that pertains to the sections of the PFS for which they take responsibility. The affiliation and areas of responsibility for each of the QPs involved in preparing the PFS, upon which the technical report will be based, are provided below.
Independent Technical Consultant Qualified Persons
- Sindy Ka Man Cheng, P.Eng., Mineral processing, metallurgical testing, process design and process plant costs
- Manochehr Oliazadeh, P.Eng., Process plant costs
- James Christopher Lane, RpGeo AIG, RPEQ, MAusIMM, CGeol., Tailings storage facility
- Graham E. Trusler, MSc, Pr Eng, MiChe, MSAIChE, Environmental studies, permitting and social or community impact
Teranga Qualified Persons
- Patti Nakai-Lajoie, P.Geo., Property description, location, accessibility, climate, local resources, infrastructure, physiography, history, geological settings, mineralization, deposit types, exploration, drilling, sample preparation, sample analyses, sample security, data verification and mineral resources
- Stephen Ling, P.Eng., Mineral reserves, mining methods, project infrastructure, market studies, contracts, mining costs, general site costs, economic analysis
Technical Report
An NI 43-101 compliant technical report for the Sabodala-Massawa Project will be filed on the Company’s website and on SEDAR (www.sedar.com) on or before August 31, 2020.
Data Verification
The QPs responsible for the preparation of the PFS and the technical report in respect thereof have verified the data disclosed in this press release, including sampling, analytical, and test data underlying the information contained in this press release. Geological, mine engineering and metallurgical reviews included, among other things, reviewing mapping, core logs, and re-logging existing drill holes, review of geotechnical and hydrological studies, environmental and community factors, the development of the life of mine plan, capital and operating costs, transportation, taxation and royalties, and review of existing metallurgical test work. In the opinion of the Qualified Persons, the data, assumptions, and parameters used to estimate mineral resources and mineral reserves, the metallurgical model, the economic analysis, and the PFS are sufficiently reliable for those purposes. The technical report in respect of the PFS, when filed, will contain more detailed information concerning individual responsibilities, associated quality assurance and quality control, and other data verification matters, and the key assumptions, parameters and methods used by the Company.
Endnotes
(1) The Company has included non-IFRS measures in this document, including total cash costs, total cash costs per ounce, AISC, and AISC per ounce. The Company believes that these measures, in addition to conventional measures prepared in accordance with IFRS, provide investors an improved ability to evaluate the underlying performance of the Company. The non-IFRS measures are intended to provide additional information and should not be considered in isolation or as a substitute for measures of performance prepared in accordance with IFRS. These measures do not have any standardized meaning prescribed under IFRS, and therefore may not be comparable to other issuers.Total cash costs figures are calculated in accordance with a standard developed by The Gold Institute, which was a worldwide association of suppliers of gold and gold products and included leading North American gold producers. The Gold Institute ceased operations in 2002, but the standard is considered the accepted standard of reporting cash cost of production in North America. Adoption of the standard is voluntary and the cost measures presented may not be comparable to other similarly titled measure of other companies. Total cash cost per ounce sold is a common financial performance measure in the gold mining industry but has no standard meaning under IFRS. The Company reports total cash costs on a sales basis. We believe that, in addition to conventional measures prepared in accordance with IFRS, certain investors use this information to evaluate the Company’s performance and ability to generate cash flow. Accordingly, it is intended to provide additional information and should not be considered in isolation or as a substitute for measures of performance prepared in accordance with IFRS. The measure, along with sales, is considered to be a key indicator of a Company’s ability to generate operating profits and cash flow from its mining operations.
Beginning in the second quarter 2013, we adopted an AISC measure consistent with the guidance issued by the World Gold Council (“WGC”) on June 27, 2013, of which Teranga became a member on November 27, 2018. The Company believes that the use of AISC is helpful to analysts, investors and other stakeholders of the Company in assessing its operating performance, its ability to generate free cash flow from current operations and its overall value. This measure is helpful to governments and local communities in understanding the economics of gold mining. AISC is an extension of existing “cash cost” metrics and incorporate costs related to sustaining production. The WGC definition of AISC seeks to extend the definition of total cash costs by adding corporate general and administrative costs, reclamation and remediation costs (including accretion and amortization), exploration and study costs (capital and expensed), capitalized stripping costs and sustaining capital expenditures and represents the total costs of producing gold from current operations. AISC excludes income tax payments, interest costs, costs related to business acquisitions and items needed to normalize profits. Consequently, this measure is not representative of all of the Company’s cash expenditures. In addition, the calculation of AISC does not include depreciation expense as it does not reflect the impact of expenditures incurred in prior periods. Therefore, it is not indicative of the Company’s overall profitability. Life of mine total cash costs and AISC used in this press release are before cash/non-cash inventory movements and amortized advanced royalty costs, and exclude any allocation of corporate overheads. Other companies may calculate this measure differently.
For more information regarding these measures, please refer to Teranga’s Management’s Discussion and Analysis for the three months ended March 31, 2020 accessible on the Company’s website at www.terangagold.com.
(2) Life of mine assumptions include:
- Gold price: $1,600 per ounce
- Heavy fuel oil (HFO): $0.35 per litre
- Light fuel oil (LFO): $0.65 per litre
- Euro to USD Exchange Rate: 1.10:1
(3) This production target is based on proven and probable minerals reserves for the Sabodala-Massawa Project and the Wahgnion Gold Operation as at December 31, 2019 as disclosed on the Company's website at www.terangagold.com and on SEDAR at www.sedar.com. The estimated reserves underpinning this production target have been prepared by a competent and qualified person or persons (see Competent and Qualified Persons Statement in this press release).
(4) Production profiles are based on proven and probable minerals reserves for the Sabodala-Massawa Project as at December 31, 2019 as disclosed on the Company’s website at www.terangagold.com and on SEDAR at www.sedar.com. The estimated reserves underpinning these production targets have been prepared by a competent and qualified person or persons (see Competent and Qualified Persons Statement in this press release).
(5) Over the past several years more than twelve million ounces of measured and indicated resources have been identified within the south eastern Senegal region, including the Massawa, Golouma, Makabingui and Mako projects, along with the Company’s own Sabodala gold mine. With exploration work completed to date and the prior exploration success seen in the area, Management believes there is a reasonable basis to anticipate future resource to reserve conversion.
Forward-Looking Statements
This press release contains certain statements that constitute forward-looking information within the meaning of applicable securities laws ("forward-looking statements"), which reflects management's expectations regarding Teranga’s future growth opportunities, results of operations, performance (both operational and financial) and business prospects (including the timing and development of new deposits and the success of exploration activities) and other opportunities. Wherever possible, words such as "plans", "expects", "does not expect", "scheduled", "trends", "indications", "potential", "estimates", "predicts", "anticipate", “to establish”, "does not anticipate", "believe", "intend", "ability to" and similar expressions or statements that certain actions, events or results "may", "could", "would", "might", "will", or are "likely" to be taken, occur or be achieved, have been used to identify such forward looking information. Specific forward-looking statements in this press release include, but are not limited to, the results of the PFS and the anticipated capital and operating costs, the timeline for completing a DFS, sustaining costs, net present value, process capacity, average annual gold production, average process recoveries, anticipated mining and processing methods, proposed PFS production schedule and gold production profile, anticipated construction, anticipated mine life, expected recoveries and grades, anticipated production rates, infrastructure, future financial or operating performance of the Company and its projects, estimation of mineral resources, exploration results, opportunities for exploration, development and expansion of the Massawa Project, its potential mineralization, the future price of gold, the realization of mineral reserve estimates, costs and timing of future exploration, and the timing of the development of new deposits. Although the forward-looking information contained in this press release reflect management's current beliefs based upon information currently available to management and based upon what management believes to be reasonable assumptions, Teranga cannot be certain that actual results will be consistent with such forward-looking information. Such forward-looking statements are based upon assumptions, opinions and analysis made by management in light of its experience, current conditions and its expectations of future developments that management believe to be reasonable and relevant but that may prove to be incorrect. These assumptions include, among other things, the closing and timing of financing, the ability to obtain any requisite governmental approvals, the accuracy of mineral reserve and mineral resource estimates, gold price, exchange rates, fuel and energy costs, future economic conditions, anticipated future estimates of free cash flow, and courses of action. Teranga cautions you not to place undue reliance upon any such forward-looking statements.
The risks and uncertainties that may affect forward-looking statements include, among others: the inherent risks involved in exploration and development of mineral properties, including government approvals and permitting, changes in economic conditions, changes in the worldwide price of gold and other key inputs, changes in mine plans and other factors, such as project execution delays, many of which are beyond the control of Teranga, as well as other risks and uncertainties which are more fully described in Teranga's 2019 Annual Information Form dated March 30, 2020, and in other filings of Teranga with securities and regulatory authorities which are available on SEDAR at www.sedar.com. Teranga does not undertake any obligation to update forward-looking statements should assumptions related to these plans, estimates, projections, beliefs and opinions change. Nothing in this document should be construed as either an offer to sell or a solicitation to buy or sell Teranga securities. All references to Teranga include its subsidiaries unless the context requires otherwise.
About Teranga
Teranga Gold is transitioning into a mid-tier gold producer operating long-life, low-cost mines and advancing prospective exploration properties across West Africa, one of the world’s fastest growing gold jurisdictions. The top-tier gold complex created by integrating the recently acquired high-grade Massawa Project with the Company’s Sabodala mine, the successful commissioning of Wahgnion, Teranga’s second gold mine and a strong pipeline of early to advanced-stage exploration assets support the continued growth of Teranga’s reserves, production and cash flow. Through its continued success and commitment to responsible mining, Teranga creates sustainable value for all stakeholders and acts as a catalyst for social, economic, and environmental development.
Contact Information
| Richard Young President & CEO T: +1 416-594-0000 | E: ryoung@terangagold.com |
Trish Moran VP, Investor Relations & Corporate Communications T: +1 416-607-4507 | E: tmoran@terangagold.com |
APPENDIX
Table A – Open-Pit and Underground Mineral Resource Estimate as at December 31, 2019
| Deposit | Domain | Measured | Indicated | Measured and Indicated | Inferred | ||||||||
| Tonnes | Grade | Au | Tonnes | Grade | Au | Tonnes | Grade | Au | Tonnes | Grade | Au | ||
| ('000s) | g/t Au | '000s | ('000s) | g/t Au | ('000s) | ('000s) | g/t Au | ('000s) | ('000s) | g/t Au | ('000s) | ||
| Sabodala | Open-Pit | 8,663 | 1.32 | 369 | 5,975 | 1.61 | 310 | 14,638 | 1.44 | 678 | 2,453 | 1.24 | 98 |
| Underground | 1,631 | 3.65 | 191 | 1,631 | 3.65 | 191 | 460 | 3.60 | 53 | ||||
| Combined | 8,663 | 1.32 | 369 | 7,606 | 2.05 | 501 | 16,270 | 1.66 | 870 | 2,913 | 1.61 | 151 | |
| Masato | Open-Pit | 2,458 | 0.69 | 55 | 22,212 | 1.16 | 829 | 24,670 | 1.11 | 884 | |||
| Underground | 1,163 | 2.75 | 103 | 1,163 | 2.75 | 103 | 1,984 | 2.85 | 182 | ||||
| Combined | 2,458 | 0.69 | 55 | 23,375 | 1.24 | 932 | 25,833 | 1.19 | 987 | 1,984 | 2.85 | 182 | |
| Gora | Open-Pit | ||||||||||||
| Underground | 274 | 4.92 | 43 | 274 | 4.92 | 43 | 56 | 4.87 | 9 | ||||
| Combined | 274 | 4.92 | 43 | 274 | 4.92 | 43 | 56 | 4.87 | 9 | ||||
| Golouma | Open-Pit | 354 | 0.75 | 9 | 3,497 | 2.93 | 329 | 3,851 | 2.73 | 338 | 55 | 2.79 | 5 |
| Underground | 2,136 | 4.09 | 281 | 2,136 | 4.09 | 281 | 851 | 3.66 | 100 | ||||
| Combined | 354 | 0.75 | 9 | 5,634 | 3.37 | 610 | 5,988 | 3.21 | 619 | 906 | 3.61 | 105 | |
| Kerekounda | Open-Pit | ||||||||||||
| Underground | 499 | 4.88 | 78 | 499 | 4.88 | 78 | 235 | 5.70 | 43 | ||||
| Combined | 499 | 4.88 | 78 | 499 | 4.88 | 78 | 235 | 5.70 | 43 | ||||
| Maki Medina | Open-Pit | 115 | 0.78 | 3 | 1,053 | 1.21 | 41 | 1,168 | 1.17 | 44 | 42 | 1.00 | 1 |
| Underground | 179 | 2.73 | 16 | 179 | 2.73 | 16 | 90 | 2.56 | 7 | ||||
| Combined | 115 | 0.78 | 2,874 | 1,232 | 1.43 | 57 | 1,347 | 1.38 | 60 | 132 | 2.06 | 9 | |
| Niakafiri East | Open-Pit | 4,776 | 1.37 | 210 | 14,140 | 1.14 | 516 | 18,916 | 1.19 | 726 | 4,515 | 0.93 | 135 |
| Underground | 224 | 2.72 | 20 | 224 | 2.72 | 20 | 514 | 2.70 | 45 | ||||
| Combined | 4,776 | 1.37 | 210 | 14,364 | 1.16 | 536 | 19,140 | 1.21 | 746 | 5,030 | 1.11 | 180 | |
| Niakafiri West | Open-Pit | 3,061 | 1.02 | 100 | 3,061 | 1.02 | 100 | 673 | 0.86 | 19 | |||
| Underground | 74 | 2.67 | 6 | 74 | 2.67 | 6 | 71 | 2.84 | 6 | ||||
| Combined | 3,135 | 1.06 | 107 | 3,135 | 1.06 | 107 | 744 | 1.05 | 25 | ||||
| Goumbati West - Kobokoto | Open-Pit | 2,678 | 1.35 | 116 | 2,678 | 1.35 | 116 | 498 | 0.81 | 13 | |||
| Underground | 131 | 3.25 | 14 | 131 | 3.25 | 14 | 79 | 2.90 | 7 | ||||
| Combined | 2,809 | 1.44 | 130 | 2,809 | 1.44 | 130 | 577 | 1.09 | 20 | ||||
| Golouma North | Open-Pit | 170 | 1.32 | 7 | 170 | 1.32 | 7 | 295 | 1.42 | 14 | |||
| Underground | 14 | 2.64 | 1 | 14 | 2.64 | 1 | 19 | 2.93 | 2 | ||||
| Combined | 184 | 1.42 | 8 | 184 | 1.42 | 8 | 314 | 1.51 | 15 | ||||
| Diadiako | Open-Pit | 178 | 1.27 | 7 | |||||||||
| Underground | 663 | 2.89 | 61 | ||||||||||
| Combined | 841 | 2.54 | 69 | ||||||||||
| Kinemba | Open-Pit | 24 | 1.06 | 1 | 24 | 1.06 | 1 | 91 | 0.95 | 3 | |||
| Underground | 56 | 2.52 | 5 | ||||||||||
| Combined | 24 | 1.06 | 1 | 24 | 1.06 | 1 | 147 | 1.55 | 7 | ||||
| Kourouloulou | Open-Pit | 96 | 11.51 | 36 | 96 | 11.51 | 36 | 22 | 6.71 | 5 | |||
| Underground | 59 | 9.15 | 18 | 59 | 9.15 | 18 | 86 | 13.58 | 38 | ||||
| Combined | 156 | 10.61 | 53 | 156 | 10.61 | 53 | 108 | 12.18 | 42 | ||||
| Kouroundi | Open-Pit | 67 | 0.93 | 2 | 67 | 0.93 | 2 | 42 | 0.74 | 1 | |||
| Underground | |||||||||||||
| Combined | 67 | 0.93 | 2 | 67 | 0.93 | 2 | 42 | 0.74 | 1 | ||||
| Koutouniokolla | Open-Pit | 85 | 1.58 | 4 | |||||||||
| Underground | 22 | 2.54 | 2 | ||||||||||
| Combined | 108 | 1.78 | 6 | ||||||||||
| Mamasato | Open-Pit | 560 | 1.45 | 26 | 560 | 1.45 | 26 | 305 | 1.25 | 12 | |||
| Underground | 42 | 2.32 | 3 | ||||||||||
| Combined | 560 | 1.45 | 26 | 560 | 1.45 | 26 | 347 | 1.38 | 15 | ||||
| Marougou | Open-Pit | 1,198 | 1.41 | 54 | |||||||||
| Underground | |||||||||||||
| Combined | 1,198 | 1.41 | 54 | ||||||||||
| Sekoto | Open-Pit | 485 | 0.89 | 14 | |||||||||
| Underground | 25 | 2.11 | 2 | ||||||||||
| Combined | 510 | 0.95 | 16 | ||||||||||
| Soukhoto | Open-Pit | 550 | 1.46 | 26 | |||||||||
| Underground | |||||||||||||
| Combined | 550 | 1.46 | 26 | ||||||||||
| Sofia | Open-Pit | 9,881 | 2.46 | 782 | 9,881 | 2.46 | 782 | 1,302 | 1.68 | 70 | |||
| Underground | |||||||||||||
| Combined | 9,881 | 2.46 | 782 | 9,881 | 2.46 | 782 | 1,302 | 1.68 | 70 | ||||
| Massawa CZ | Open-Pit | 494 | 4.57 | 73 | 11,654 | 3.52 | 1,319 | 12,148 | 3.56 | 1,391 | 2,747 | 3.12 | 276 |
| Underground | |||||||||||||
| Combined | 494 | 4.57 | 73 | 11,654 | 3.52 | 1,319 | 12,148 | 3.56 | 1,391 | 2,747 | 3.12 | 276 | |
| Massawa NZ | Open-Pit | 5,748 | 4.79 | 885 | 5,748 | 4.79 | 885 | 185 | 5.30 | 31 | |||
| Underground | 2,582 | 4.50 | 373 | ||||||||||
| Combined | 5,748 | 4.79 | 885 | 5,748 | 4.79 | 885 | 2,767 | 4.55 | 405 | ||||
| Delya | Open-Pit | 760 | 4.46 | 109 | 760 | 4.46 | 109 | 95 | 3.76 | 12 | |||
| Underground | |||||||||||||
| Combined | 760 | 4.46 | 109 | 760 | 4.46 | 109 | 95 | 3.76 | 12 | ||||
| Tina | Open-Pit | 1,929 | 1.05 | 65 | |||||||||
| Underground | |||||||||||||
| Combined | 1,929 | 1.05 | 65 | ||||||||||
| Bambaraya | Open-Pit | 537 | 2.15 | 37 | |||||||||
| Underground | |||||||||||||
| Combined | 537 | 2.15 | 37 | ||||||||||
| Total | Open-Pit | 16,860 | 1.32 | 717 | 81,578 | 2.06 | 5,409 | 98,438 | 1.94 | 6,127 | 18,285 | 1.53 | 902 |
| Underground | 6,384 | 3.75 | 771 | 6,384 | 3.75 | 771 | 7,836 | 3.72 | 938 | ||||
| Combined | 16,860 | 1.32 | 717 | 87,962 | 2.19 | 6,180 | 104,823 | 2.05 | 6,897 | 26,120 | 2.19 | 1,840 | |
Notes to Table A above:
- CIM definitions were followed for Mineral Resources.
- Open pit oxide Mineral Resources are estimated at cut-off grades ranging from 0.35 g/t Au to 0.50 g/t Au.
- Open pit transition and primary rock Mineral Resources are estimated at cut-off grades ranging from 0.40 g/t Au to 1.20 g/t Au.
- Underground Mineral Resources are estimated at a cut-off grade of 2.00 g/t Au at Sabodala, and at 2.84 g/t Au at Massawa.
- Measured Resources at Sabodala include stockpiles, which total 4.3 Mt at 0.75 g/t Au for 104,000 oz.
- Measured Resources at Masato include stockpiles, which total 2.5 Mt at 0.69 g/t Au for 55,000 oz.
- Measured Resources at Maki Medina include stockpiles, which total 0.1 Mt at 0.78 g/t Au for 3,000 oz.
- Measured Resources at Golouma include stockpiles, which total 0.4 Mt at 0.75 g/t Au for 9,000 oz.
- High grade assays were capped at grades ranging from 1.5 g/t Au to 340 g/t Au.
- Mineral Resources are inclusive of Mineral Reserves.
- Open-pit shells were used to constrain open-pit resources.
- Mineral Resources are estimated using a gold price of $1,450 per ounce.
- Sum of individual amounts may not equal due to rounding.
Table B – Sabodala-Massawa Mineral Reserve Estimate as at December 31, 2019
| Deposits | Proven | Probable | Proven and Probable | ||||||
| Tonnes (Mt) | Grade (g/t) | Au (Moz) | Tonnes (Mt) | Grade (g/t) | Au (Moz) | Tonnes (Mt) | Grade (g/t) | Au (Moz) | |
| Sabodala | 1.88 | 1.64 | 0.10 | 2.75 | 1.41 | 0.12 | 4.63 | 1.50 | 0.22 |
| Masato | 17.77 | 1.13 | 0.64 | 17.77 | 1.13 | 0.64 | |||
| Golouma West | 2.10 | 2.01 | 0.14 | 2.10 | 2.01 | 0.14 | |||
| Maki Medina | 0.84 | 1.19 | 0.03 | 0.84 | 1.19 | 0.03 | |||
| Niakafiri East | 4.49 | 1.34 | 0.19 | 9.43 | 1.14 | 0.34 | 13.92 | 1.20 | 0.54 |
| Niakafiri West | 1.13 | 1.10 | 0.04 | 1.13 | 1.10 | 0.04 | |||
| Goumbati West and Kobokoto | 1.39 | 1.33 | 0.06 | 1.39 | 1.33 | 0.06 | |||
| Stockpiles | 7.22 | 0.73 | 0.17 | 7.22 | 0.73 | 0.17 | |||
| Subtotal Open-Pit with Stockpiles | 13.59 | 1.06 | 0.46 | 35.40 | 1.21 | 1.38 | 48.99 | 1.17 | 1.84 |
| Golouma West 1 Underground | 0.62 | 6.07 | 0.12 | 0.62 | 6.07 | 0.12 | |||
| Golouma West 2 Underground | 0.45 | 4.39 | 0.06 | 0.45 | 4.39 | 0.06 | |||
| Golouma South Underground | 0.47 | 4.28 | 0.06 | 0.47 | 4.28 | 0.06 | |||
| Kerekounda Underground | 0.61 | 4.95 | 0.10 | 0.61 | 4.95 | 0.10 | |||
| Subtotal Underground | 2.15 | 5.01 | 0.35 | 2.15 | 5.01 | 0.35 | |||
| Total Sabodala Mine Lease | 13.59 | 1.06 | 0.46 | 37.55 | 1.43 | 1.73 | 51.14 | 1.33 | 2.19 |
| Sofia Main | 5.47 | 2.66 | 0.47 | 5.47 | 2.66 | 0.47 | |||
| Sofia North | 2.76 | 1.87 | 0.17 | 2.76 | 1.87 | 0.17 | |||
| Central Zone | 0.54 | 3.94 | 0.07 | 9.40 | 3.52 | 1.06 | 9.94 | 3.54 | 1.13 |
| North Zone | 5.60 | 4.23 | 0.76 | 5.60 | 4.23 | 0.76 | |||
| Delya | 0.88 | 3.56 | 0.10 | 0.88 | 3.56 | 0.10 | |||
| Total Massawa Mine Lease | 0.54 | 3.94 | 0.07 | 24.11 | 3.30 | 2.56 | 24.65 | 3.32 | 2.63 |
| Total Reserves | 14.13 | 1.17 | 0.53 | 61.67 | 2.16 | 4.29 | 75.79 | 1.98 | 4.82 |
Notes to Table B above:
- CIM definitions were followed for Mineral Reserves. Open pit oxide Mineral Resources are estimated at cut-off grades ranging from 0.35 g/t Au to 0.50 g/t Au.
- Mineral Reserve cut-off grades range from 0.41 g/t to 0.61 g/t Au for oxide, 0.47 g/t to 0.79 g/t Au for fresh rock and 1.39 g/t to 1.41 g/t Au for refractory ore, based on a $1,250/oz gold price.
- Underground Mineral Reserve cut-off grades range from 2.3 g/t to 2.6 g/t Au based on a $1,200/oz gold price.
- Mineral Reserves account for mining dilution and mining ore loss.
- Proven Mineral Reserves are based on Measured Mineral Resources only.
- Probable Mineral Reserves are based on Indicated Mineral Resources only.
- Sum of individual amounts may not equal due to rounding.
- The Niakafiri Main deposit is adjacent to the Sabodala village and relocation of at least some portion of the village will be required which will necessitate a negotiated resettlement program with the affected community members.
Table C – Life of Mine Plan
| LOM | 2020 | 2021 | 2022 | 2023 | 2024 | 2025 | 2026 | 2027 | 2028 | 2029 | 2030 | 2031 | 2032 | 2033 | 2034 | 2035 | 2036 | |||||||||||||||||||||
| Sabodala | Ore Mined | Mt | 4.6 | 1.0 | 0.6 | 0.2 | 2.5 | 0.4 | ||||||||||||||||||||||||||||||
| Ore Grade | g/t | 1.50 | 1.36 | 1.31 | 1.06 | 1.64 | 1.49 | |||||||||||||||||||||||||||||||
| Contained Oz | Moz | 0.22 | 0.04 | 0.03 | 0.01 | 0.13 | 0.02 | |||||||||||||||||||||||||||||||
| Waste | Mt | 35.9 | 9.4 | 1.6 | 14.4 | 9.5 | 1.0 | |||||||||||||||||||||||||||||||
| Golouma | Ore Mined | Mt | 2.1 | 2.1 | ||||||||||||||||||||||||||||||||||
| Ore Grade | g/t | 2.01 | 2.01 | |||||||||||||||||||||||||||||||||||
| Contained Oz | Moz | 0.14 | 0.14 | |||||||||||||||||||||||||||||||||||
| Waste | Mt | 8.3 | 8.3 | |||||||||||||||||||||||||||||||||||
| Maki Medina | Ore Mined | Mt | 0.8 | 0.8 | ||||||||||||||||||||||||||||||||||
| Ore Grade | g/t | 1.19 | 1.19 | |||||||||||||||||||||||||||||||||||
| Contained Oz | Moz | 0.03 | 0.03 | |||||||||||||||||||||||||||||||||||
| Waste | Mt | 3.6 | 3.6 | |||||||||||||||||||||||||||||||||||
| Niakafiri | Ore Mined | Mt | 15.1 | 1.5 | 4.7 | 2.1 | 3.5 | 3.2 | ||||||||||||||||||||||||||||||
| Ore Grade | g/t | 1.19 | 1.25 | 1.24 | 1.03 | 0.99 | 1.43 | |||||||||||||||||||||||||||||||
| Contained Oz | Moz | 0.58 | 0.06 | 0.19 | 0.07 | 0.11 | 0.15 | |||||||||||||||||||||||||||||||
| Waste | Mt | 59.8 | 4.5 | 9.8 | 15.9 | 25.0 | 4.6 | |||||||||||||||||||||||||||||||
| Goumbati West Kobokoto |
Ore Mined | Mt | 1.4 | 0.1 | 0.4 | 0.9 | ||||||||||||||||||||||||||||||||
| Ore Grade | g/t | 1.33 | 1.34 | 1.74 | 1.17 | |||||||||||||||||||||||||||||||||
| Contained Oz | Moz | 0.06 | 0.00 | 0.02 | 0.03 | |||||||||||||||||||||||||||||||||
| Waste | Mt | 11.8 | 0.6 | 3.5 | 7.6 | |||||||||||||||||||||||||||||||||
| Masato | Ore Mined | Mt | 17.8 | 0.5 | 1.5 | 5.6 | 4.9 | 3.3 | 1.8 | |||||||||||||||||||||||||||||
| Ore Grade | g/t | 1.13 | 0.80 | 0.95 | 1.12 | 1.24 | 0.95 | 1.41 | ||||||||||||||||||||||||||||||
| Contained Oz | Moz | 0.64 | 0.01 | 0.05 | 0.20 | 0.20 | 0.10 | 0.08 | ||||||||||||||||||||||||||||||
| Waste | Mt | 114.0 | 13.1 | 28.4 | 24.4 | 25.0 | 21.6 | 1.5 | ||||||||||||||||||||||||||||||
| Sofia (North/Main) |
Ore Mined | Mt | 8.2 | 2.0 | 1.3 | 3.0 | 0.2 | 1.6 | 0.1 | |||||||||||||||||||||||||||||
| Ore Grade | g/t | 2.40 | 2.50 | 2.84 | 2.54 | 1.39 | 1.82 | 1.77 | ||||||||||||||||||||||||||||||
| Contained Oz | Moz | 0.63 | 0.16 | 0.12 | 0.24 | 0.01 | 0.09 | 0.01 | ||||||||||||||||||||||||||||||
| Waste | Mt | 45.0 | 9.2 | 12.3 | 13.9 | 1.2 | 7.6 | 0.8 | ||||||||||||||||||||||||||||||
| Central Zone | Ore Mined | Mt | 9.9 | 2.0 | 1.6 | 1.7 | 4.4 | 0.2 | ||||||||||||||||||||||||||||||
| Ore Grade | g/t | 3.54 | 2.54 | 2.89 | 3.77 | 4.07 | 5.36 | |||||||||||||||||||||||||||||||
| Contained Oz | Moz | 1.13 | 0.16 | 0.15 | 0.21 | 0.57 | 0.04 | |||||||||||||||||||||||||||||||
| Waste | Mt | 33.9 | 6.1 | 6.7 | 7.4 | 13.2 | 0.5 | |||||||||||||||||||||||||||||||
| North Zone | Ore Mined | Mt | 5.6 | 0.6 | 1.0 | 1.5 | 0.9 | 1.6 | ||||||||||||||||||||||||||||||
| Ore Grade | g/t | 4.23 | 3.83 | 4.70 | 3.32 | 4.04 | 5.12 | |||||||||||||||||||||||||||||||
| Contained Oz | Moz | 0.76 | 0.07 | 0.15 | 0.17 | 0.12 | 0.26 | |||||||||||||||||||||||||||||||
| Waste | Mt | 67.2 | 10.8 | 10.7 | 23.0 | 15.5 | 7.3 | |||||||||||||||||||||||||||||||
| Delya | Ore Mined | Mt | 0.9 | 0.9 | ||||||||||||||||||||||||||||||||||
| Ore Grade | g/t | 3.56 | 3.56 | |||||||||||||||||||||||||||||||||||
| Contained Oz | Moz | 0.10 | 0.10 | |||||||||||||||||||||||||||||||||||
| Waste | Mt | 6.8 | 6.8 | |||||||||||||||||||||||||||||||||||
| Underground | Ore Mined | Mt | 2.1 | 0.1 | 0.3 | 0.3 | 0.3 | 0.1 | 0.2 | 0.4 | 0.4 | 0.2 | ||||||||||||||||||||||||||
| Ore Grade | g/t | 5.01 | 5.00 | 4.95 | 4.63 | 4.33 | 4.39 | 5.55 | 5.36 | 5.52 | 4.76 | |||||||||||||||||||||||||||
| Contained Oz | Moz | 0.35 | 0.02 | 0.05 | 0.05 | 0.04 | 0.01 | 0.03 | 0.06 | 0.07 | 0.02 | |||||||||||||||||||||||||||
| Summary | Ore Mined | Mt | 68.6 | 6.0 | 4.9 | 5.6 | 3.5 | 5.3 | 5.8 | 5.0 | 4.5 | 4.0 | 4.9 | 1.9 | 5.9 | 5.0 | 3.5 | 2.2 | 0.4 | 0.2 | ||||||||||||||||||
| Ore Grade | g/t | 2.11 | 1.94 | 2.57 | 3.02 | 3.42 | 4.07 | 2.96 | 1.25 | 1.36 | 1.14 | 1.52 | 1.63 | 1.26 | 1.30 | 1.17 | 2.07 | 5.52 | 4.76 | |||||||||||||||||||
| Contained Oz | Moz | 4.65 | 0.37 | 0.40 | 0.54 | 0.38 | 0.69 | 0.55 | 0.20 | 0.20 | 0.15 | 0.24 | 0.10 | 0.24 | 0.21 | 0.13 | 0.15 | 0.07 | 0.02 | |||||||||||||||||||
| Waste | Mt | 386.4 | 31.2 | 34.3 | 31.4 | 31.5 | 28.7 | 26.7 | 25.0 | 25.4 | 26.0 | 25.3 | 28.4 | 24.4 | 25.0 | 21.6 | 1.5 | 0.0 | 0.0 | |||||||||||||||||||
| Movement | Mt | 455.0 | 37.2 | 39.2 | 36.9 | 35.0 | 34.0 | 32.4 | 30.1 | 30.0 | 30.0 | 30.2 | 30.3 | 30.2 | 30.1 | 25.1 | 3.7 | 0.4 | 0.2 | |||||||||||||||||||
| Summary | Stockpile Ore Balance | Mt | 9.1 | 9.7 | 11.0 | 9.0 | 8.8 | 9.1 | 8.7 | 7.9 | 7.2 | 7.9 | 5.6 | 7.3 | 8.1 | 7.4 | 5.4 | 1.7 | 0.0 | |||||||||||||||||||
| Stockpile Grade | g/t | 0.91 | 0.87 | 1.16 | 1.16 | 1.97 | 2.25 | 1.47 | 1.01 | 0.90 | 1.02 | 0.93 | 0.91 | 0.88 | 0.70 | 0.69 | 0.69 | 0.00 | ||||||||||||||||||||
| Contained Oz | Moz | 0.27 | 0.27 | 0.41 | 0.33 | 0.56 | 0.66 | 0.41 | 0.26 | 0.21 | 0.26 | 0.17 | 0.21 | 0.23 | 0.17 | 0.12 | 0.04 | 0.00 | ||||||||||||||||||||
| |
||||||||||||||||||||||||||||||||||||||
LOM PROCESSING PLAN |
LOM | 2020 | 2021 | 2022 | 2023 | 2024 | 2025 | 2026 | 2027 | 2028 | 2029 | 2030 | 2031 | 2032 | 2033 | 2034 | 2035 | 2036 | ||||||||||||||||||||
| Mill Production Sabodala WOL Ore |
Ore Milled | Mt | 51.1 | 3.1 | 1.1 | 0.6 | 1.5 | 0.9 | 1.8 | 2.8 | 4.0 | 4.2 | 4.2 | 4.2 | 4.2 | 4.2 | 4.2 | 4.2 | 4.0 | 1.9 | ||||||||||||||||||
| Head Grade | g/t | 1.33 | 1.89 | 1.45 | 0.89 | 0.73 | 0.71 | 1.17 | 1.52 | 1.38 | 0.94 | 1.40 | 1.42 | 1.43 | 1.42 | 1.43 | 1.44 | 1.15 | 1.02 | |||||||||||||||||||
| Contained Oz | Moz | 2.19 | 0.19 | 0.05 | 0.02 | 0.03 | 0.02 | 0.07 | 0.14 | 0.18 | 0.13 | 0.19 | 0.19 | 0.19 | 0.19 | 0.19 | 0.19 | 0.15 | 0.06 | |||||||||||||||||||
| Oxide | % | 15 | % | 12 | % | 35 | % | 40 | % | 49 | % | 50 | % | 63 | % | 27 | % | 28 | % | 7 | % | 22 | % | 10 | % | 4 | % | 11 | % | 4 | % | 0 | % | 0 | % | 0 | % | |
| Produced Oz | Moz | 1.97 | 0.17 | 0.05 | 0.02 | 0.03 | 0.02 | 0.06 | 0.12 | 0.16 | 0.11 | 0.17 | 0.17 | 0.17 | 0.17 | 0.17 | 0.17 | 0.13 | 0.06 | |||||||||||||||||||
| Mill Production Massawa WOL Ore |
Ore Milled | Mt | 18.2 | 1.0 | 3.2 | 3.7 | 2.8 | 3.4 | 2.4 | 1.4 | 0.2 | |||||||||||||||||||||||||||
| Head Grade | g/t | 2.44 | 2.67 | 3.42 | 3.25 | 1.75 | 2.06 | 1.68 | 1.76 | 1.23 | ||||||||||||||||||||||||||||
| Contained Oz | Moz | 1.43 | 0.09 | 0.35 | 0.39 | 0.16 | 0.23 | 0.13 | 0.08 | 0.01 | ||||||||||||||||||||||||||||
| Oxide | % | 48 | % | 71 | % | 56 | % | 39 | % | 65 | % | 33 | % | 44 | % | 47 | % | 33 | % | |||||||||||||||||||
| Produced Oz | Moz | 1.25 | 0.08 | 0.31 | 0.34 | 0.14 | 0.18 | 0.12 | 0.07 | 0.01 | ||||||||||||||||||||||||||||
| Mill Production Massawa ROT Ore |
Ore Milled | Mt | 6.5 | 1.2 | 1.2 | 1.2 | 1.2 | 1.2 | 0.5 | |||||||||||||||||||||||||||||
| Head Grade | g/t | 5.77 | 6.82 | 5.83 | 6.42 | 5.99 | 4.44 | 4.24 | ||||||||||||||||||||||||||||||
| Contained Oz | Moz | 1.20 | 0.26 | 0.23 | 0.25 | 0.23 | 0.17 | 0.07 | ||||||||||||||||||||||||||||||
| Oxide | % | 0 | % | 0 | % | 0 | % | 0 | % | 0 | % | 0 | % | 0 | % | |||||||||||||||||||||||
| Produced Oz | Moz | 1.06 | 0.23 | 0.20 | 0.22 | 0.20 | 0.15 | 0.06 | ||||||||||||||||||||||||||||||
| Total Mill Production |
Ore Milled | Mt | 75.8 | 4.1 | 4.2 | 4.3 | 5.5 | 5.5 | 5.5 | 5.4 | 5.4 | 4.7 | 4.2 | 4.2 | 4.2 | 4.2 | 4.2 | 4.2 | 4.0 | 1.9 | ||||||||||||||||||
| Head Grade | g/t | 1.98 | 2.08 | 2.92 | 2.92 | 2.57 | 2.68 | 2.55 | 2.57 | 2.05 | 1.29 | 1.40 | 1.42 | 1.43 | 1.42 | 1.43 | 1.44 | 1.15 | 1.02 | |||||||||||||||||||
| Contained Oz | Moz | 4.82 | 0.28 | 0.40 | 0.40 | 0.46 | 0.47 | 0.45 | 0.45 | 0.36 | 0.19 | 0.19 | 0.19 | 0.19 | 0.19 | 0.19 | 0.19 | 0.15 | 0.06 | |||||||||||||||||||
| Oxide | % | 22 | % | 27 | % | 50 | % | 39 | % | 47 | % | 28 | % | 41 | % | 27 | % | 22 | % | 7 | % | 22 | % | 10 | % | 4 | % | 11 | % | 4 | % | 0 | % | 0 | % | 0 | % | |
| Produced Oz | Moz | 4.28 | 0.24 | 0.36 | 0.36 | 0.40 | 0.40 | 0.40 | 0.40 | 0.32 | 0.17 | 0.17 | 0.17 | 0.17 | 0.17 | 0.17 | 0.17 | 0.13 | 0.06 | |||||||||||||||||||
Table D – Life of Mine Capital Expenditures
|
Sustaining Capex |
Unit |
LOM |
5-Year Average 2021- 2025 |
10-Year Average 2021- 2025 |
2020 |
2021 |
2022 |
2023 |
2024 |
2025 |
2026 |
2027 |
2028 |
2029 |
2030 |
2031 |
2032 |
2033 |
2034 |
2035 |
2036 |
2037 |
| Mining Equipment | US$M | 74 | 8 | 6 | 15 | 7 | 11 | 6 | 10 | 4 | 4 | 2 | 1 | 5 | 6 | 3 | - | - | - | - | - | - |
| Processing | US$M | 46 | 3 | 3 | 3 | 2 | 2 | 4 | 5 | 4 | 4 | 4 | 3 | 2 | 2 | 2 | 2 | 2 | 2 | 2 | 1 | - |
| G&A and Other Sustaining | US$M | 49 | 5 | 4 | 7 | 9 | 4 | 4 | 8 | 2 | 3 | 2 | 2 | 1 | 2 | 2 | 2 | 1 | 1 | 1 | 0 | - |
| TSF1 and TSF2 | US$M | 53 | 9 | 5 | 4 | 13 | 24 | 7 | 0 | - | - | - | - | - | 3 | - | - | 2 | - | - | - | - |
| Pit Dewatering | US$M | 19 | 4 | 2 | - | 5 | 4 | 4 | 4 | 2 | - | - | - | - | - | - | - | - | - | - | - | - |
| Total Sustaining Capex | US$M | 241 | 29 | 19 | 29 | 37 | 45 | 25 | 27 | 12 | 11 | 8 | 6 | 9 | 12 | 6 | 3 | 5 | 3 | 2 | 1 | - |
Capital Projects & Development | ||||||||||||||||||||||
| Underground Development | US$M | 102 | - | 6 | - | - | - | - | - | - | - | 24 | 23 | 9 | 2 | 1 | 9 | 18 | 10 | 4 | 1 | - |
| Massawa - Phase 1 | US$M | 37 | 2 | 1 | 29 | 8 | - | - | - | - | - | - | - | - | - | - | - | - | - | - | - | - |
| Massawa - Phase 2 | US$M | 219 | 44 | 22 | - | 71 | 148 | - | - | - | - | - | - | - | - | - | - | - | - | - | - | - |
| Community Relocation | US$M | 50 | 8 | 4 | 8 | 30 | 12 | - | - | - | - | - | - | - | - | - | - | - | - | - | - | - |
| Total Projects and Development | US$M | 409 | 54 | 33 | 37 | 109 | 160 | - | - | - | - | 24 | 23 | 9 | 2 | 1 | 9 | 18 | 10 | 4 | 1 | - |
Notes to Table D above:
(1) Sum of individual amounts may not equal due to rounding
Table E – Life of Mine Operating Costs
| Operating Costs |
Unit |
LOM |
5-Year Average 2021- 2025 |
10-Year Average 2021- 2030 |
2020 |
2021 |
2022 |
2023 |
2024 |
2025 |
2026 |
2027 |
2028 |
2029 |
2030 |
2031 |
2032 |
2033 |
2034 |
2035 |
2036 |
2037 |
||
| Open-Pit Mining | US$/t mined | 2.6 | 2.8 | 2.6 | 2.8 | 2.5 | 2.9 | 2.7 | 3.0 | 2.9 | 2.4 | 2.3 | 2.4 | 2.2 | 2.4 | 2.4 | 2.2 | 2.4 | 3.1 | - | - | - | ||
| Underground Mining | US$/t milled | 72.2 | - | 74.3 | - | - | - | - | - | - | - | - | 76.3 | 74.9 | 73.3 | 77.3 | 79.7 | 76.5 | 66.5 | 64.4 | 78.1 | - | ||
| Processing WOL | US$/t milled | 10.2 | 10.4 | 10.1 | 10.7 | 10.5 | 10.8 | 9.7 | 11.2 | 9.7 | 9.9 | 9.7 | 10.0 | 9.9 | 10.0 | 10.1 | 10.0 | 10.1 | 10.1 | 11.0 | 10.8 | - | ||
| Processing ROT | US$/t milled | 36.1 | 36.1 | 36.1 | - | - | - | 36.1 | 36.1 | 36.1 | 36.1 | 36.1 | 36.1 | - | - | - | - | - | - | - | - | - | ||
| General & Admin. | US$/t milled | 4.0 | 4.4 | 4.2 | 5.0 | 5.3 | 5.2 | 3.9 | 4.0 | 3.9 | 4.0 | 3.9 | 3.7 | 4.2 | 4.2 | 4.2 | 4.2 | 3.6 | 3.1 | 2.7 | 2.3 | - | ||
| Mining | US$M | 1,158 | 100 | 85 | 103 | 100 | 107 | 94 | 103 | 95 | 71 | 68 | 72 | 67 | 71 | 72 | 66 | 59 | 10 | - | - | - | ||
| Underground Mining | US$M | 155 | - | 5 | - | - | - | - | - | - | - | - | 7 | 22 | 26 | 20 | 7 | 13 | 24 | 25 | 12 | - | ||
| Processing WOL | US$M | 709 | 44 | 43 | 44 | 45 | 47 | 42 | 47 | 42 | 42 | 41 | 42 | 42 | 42 | 42 | 42 | 42 | 42 | 44 | 20 | - | ||
| Processing ROT | US$M | 234 | 26 | 23 | - | - | - | 43 | 43 | 43 | 43 | 43 | 18 | - | - | - | - | - | - | - | - | - | ||
| General & Admin | US$M | 304 | 22 | 21 | 21 | 22 | 22 | 22 | 22 | 22 | 22 | 21 | 18 | 18 | 18 | 18 | 18 | 15 | 13 | 11 | 4 | - | ||
| Total Operating Costs | US$M | 2,560 | 192 | 177 | 168 | 167 | 176 | 201 | 215 | 201 | 178 | 174 | 156 | 148 | 156 | 152 | 133 | 129 | 90 | 79 | 37 | - | ||
| Capitalized Deferred Stripping(1) | US$M | (13 | ) | - | - | (13 | ) | - | - | - | - | - | - | - | - | - | - | - | - | - | - | - | - | - |
| Royalties(2) | US$M | 373 | 34 | 27 | 21 | 29 | 29 | 34 | 41 | 39 | 33 | 26 | 14 | 15 | 14 | 17 | 17 | 15 | 15 | 11 | 4 | - | ||
| Total Cash Costs | US$M | 2,921 | 226 | 205 | 177 | 196 | 205 | 235 | 257 | 240 | 210 | 200 | 170 | 163 | 171 | 168 | 149 | 144 | 105 | 90 | 41 | - | ||
| Total Cash Costs(3) | US$/oz | 681 | 590 | 648 | 715 | 545 | 569 | 587 | 641 | 601 | 525 | 623 | 984 | 941 | 986 | 971 | 863 | 834 | 607 | 677 | 742 | - | ||
| Sustaining Capex | US$M | 241 | 29 | 19 | 29 | 37 | 45 | 25 | 27 | 12 | 11 | 8 | 6 | 9 | 12 | 6 | 3 | 5 | 3 | 2 | 1 | - | ||
| Capitalized Deferred Stripping(1) | US$M | 13 | - | - | 13 | - | - | - | - | - | - | - | - | - | - | - | - | - | - | - | - | - | ||
| Regional Admin | US$M | 34 | 2 | 2 | 3 | 2 | 2 | 2 | 2 | 2 | 2 | 2 | 2 | 2 | 2 | 2 | 2 | 2 | 2 | 2 | 1 | - | ||
| All-In Sustaining Costs (AISC) | US$M | 3,209 | 258 | 226 | 221 | 234 | 252 | 262 | 286 | 255 | 223 | 210 | 178 | 173 | 185 | 176 | 155 | 151 | 110 | 95 | 43 | - | ||
| AISC(3) | US$/oz | 749 | 671 | 715 | 893 | 652 | 699 | 655 | 715 | 637 | 558 | 656 | 1,028 | 1,003 | 1,069 | 1,017 | 894 | 875 | 633 | 711 | 779 | - | ||
| Development Capex | US$M | 409 | 54 | 33 | 37 | 109 | 160 | - | - | - | - | 24 | 23 | 9 | 2 | 1 | 9 | 18 | 10 | 4 | 1 | - | ||
| Franco Nevada Stream | US$M | 140 | 12 | 12 | 14 | 12 | 12 | 12 | 12 | 12 | 12 | 12 | 12 | 12 | 12 | 9 | - | - | - | - | - | - | ||
| Franco Nevada Stream | US$/oz | 33 | 31 | 37 | 55 | 33 | 33 | 29 | 29 | 29 | 29 | 37 | 68 | 68 | 68 | 51 | - | - | - | - | - | - | ||
Table F – Life of Mine Cash Flows
| Unit | LOM | 5-Year Average 2021-2025 |
10-Year Average 2021-2030 |
2020 | 2021 | 2022 | 2023 | 2024 | 2025 | 2026 | 2027 | 2028 | 2029 | 2030 | 2031 | 2032 | 2033 | 2034 | 2035 | 2036 | 2037 | ||||
| Production | Koz | 4,285 | 384 | 316 | 245 | 359 | 360 | 400 | 400 | 400 | 400 | 320 | 173 | 173 | 173 | 173 | 173 | 173 | 173 | 133 | 56 | - | |||
| Gold Price | $/oz | 1,600 | 1,600 | 1,600 | 1,600 | 1,600 | 1,600 | 1,600 | 1,600 | 1,600 | 1,600 | 1,600 | 1,600 | 1,600 | 1,600 | 1,600 | 1,600 | 1,600 | 1,600 | 1,600 | 1,600 | - | |||
| Revenue | US$M | 6,859 | 614 | 505 | 395 | 575 | 576 | 640 | 640 | 640 | 640 | 512 | 277 | 277 | 277 | 277 | 277 | 277 | 277 | 213 | 89 | - | |||
| Total Cash Cost (3) | US$M | 2,921 | 226 | 205 | 177 | 196 | 205 | 235 | 257 | 240 | 210 | 200 | 170 | 163 | 171 | 168 | 149 | 144 | 105 | 90 | 41 | - | |||
| Capex | US$M | 254 | 29 | 19 | 41 | 37 | 45 | 25 | 27 | 12 | 11 | 8 | 6 | 9 | 12 | 6 | 3 | 5 | 3 | 2 | 1 | - | |||
| Regional Administration | US$M | 34 | 2 | 2 | 3 | 2 | 2 | 2 | 2 | 2 | 2 | 2 | 2 | 2 | 2 | 2 | 2 | 2 | 2 | 2 | 1 | - | |||
| All-in Sustaining Costs (AISC) | US$M | 3,209 | 258 | 226 | 221 | 234 | 252 | 262 | 286 | 255 | 223 | 210 | 178 | 173 | 185 | 176 | 155 | 151 | 110 | 95 | 43 | - | |||
| All-in Sustaining Costs (AISC) (3) | $/oz | 749 | 671 | 715 | 893 | 652 | 699 | 655 | 715 | 637 | 558 | 656 | 1,028 | 1,003 | 1,069 | 1,017 | 894 | 875 | 633 | 711 | 779 | - | |||
| Development Capex | US$M | 409 | 54 | 33 | 37 | 109 | 160 | - | - | - | - | 24 | 23 | 9 | 2 | 1 | 9 | 18 | 10 | 4 | 1 | - | |||
| Franco-Nevada Gold Stream (4) | US$M | 140 | 12 | 12 | 14 | 12 | 12 | 12 | 12 | 12 | 12 | 12 | 12 | 12 | 12 | 9 | - | - | - | - | - | - | |||
|
Cash Flow Before Taxes, Mine Closure and Other |
US$M | 3,101 | 291 | 235 | 124 | 220 | 153 | 366 | 342 | 374 | 405 | 266 | 64 | 83 | 78 | 91 | 114 | 107 | 157 | 114 | 45 | - | |||
| Taxes, Mine Closure, and Other (5) | US$M | 664 | 61 | 57 | 41 | 41 | 70 | 65 | 68 | 61 | 68 | 73 | 47 | 11 | 12 | 9 | 10 | 16 | 13 | 15 | 43 | 1 | |||
| Net Cash Flow | US$M | 2,438 | 230 | 183 | 83 | 179 | 83 | 301 | 275 | 312 | 337 | 193 | 17 | 71 | 65 | 82 | 104 | 91 | 144 | 99 | 2 | (1 | ) | ||
| Minority Interest | US$M | 228 | 16 | 18 | - | - | 10 | 8 | 30 | 27 | 31 | 34 | 19 | 2 | 7 | 7 | 8 | 10 | 9 | 14 | 10 | 0 | |||
| Cash Flow After Minority Interest | US$M | 2,210 | 215 | 166 | 83 | 179 | 73 | 293 | 245 | 285 | 306 | 159 | (2 | ) | 70 | 58 | 76 | 96 | 81 | 135 | 84 | (8 | ) | (1 | ) |
Notes to Tables E & F above:
(1) Excludes any capitalized deferred stripping adjustments beyond 2020
(2) Royalties include Government of Senegal royalties on total production
(3) Total cash costs per ounce and all-in sustaining costs per ounce are non-IFRS financial measures and do not have a standard meaning under IFRS. Total cash costs per ounce and all-in sustaining costs per ounce are before cash/non-cash inventory movements and amortized advanced royalty costs, and excludes allocation of corporate overheads. Please refer to non-IFRS Performance Measures.
(4) The Franco-Nevada Gold Stream assumes a fixed number of gold ounces payable each year until third quarter 2031.
(5) Taxes, mine closure and other includes income taxes paid to the Government of Senegal, government social fund, initial $15 million payment in 2020 related to an advance royalty for future Massawa production, working capital, closure cost payments, and plant residual value. Sustainability costs and exploration costs are not included.
(6) Sum of individual amounts may not equal due to rounding.
A photo accompanying this announcement is available at https://www.globenewswire.com/NewsRoom/AttachmentNg/a660c8e4-963a-429e-be80-4b40b82fb5fb
![]()
Figure 1
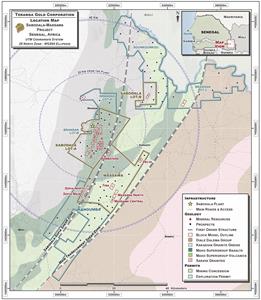
Map of Sabodala-Massawa
Legal Disclaimer:
EIN Presswire provides this news content "as is" without warranty of any kind. We do not accept any responsibility or liability for the accuracy, content, images, videos, licenses, completeness, legality, or reliability of the information contained in this article. If you have any complaints or copyright issues related to this article, kindly contact the author above.
