

Fentura Financial, Inc. Announces First Quarter 2020 Earnings
Dollars in thousands except per share amounts. Certain items in the prior period financial statements have been reclassified to conform with the March 31, 2020 presentation.
FENTON, Mich., May 04, 2020 (GLOBE NEWSWIRE) -- Fentura Financial, Inc. (OTCQX: FETM) announces quarterly results of net income of $3,352 for the three month period ended March 31, 2020.
- 3.52% increase in total assets since December 31, 2019
- 6.88% increase in gross loans since March 31, 2019
- 2.40% increase in total deposits since December 31, 2019
- Net interest margin of 3.61% for the quarter ended March 31, 2020
“Considering the challenging environment we faced in the first quarter of 2020 based on the global pandemic, I am pleased with our operating results,” said Fentura’s President and CEO Ronald Justice. “Despite the pressures faced by the organization based on the impact of the Coronavirus, we have taken measures to protect the safety of our team while continuing to meet the needs of our clients. Our branch offices remain open by appointment, while the majority of banking transactions have been processed through online banking, our mobile application and ITMs. Recognizing the financial pressures placed on so many, we have actively worked with individuals, families and business clients to defer loan payments and created a short term, interest free loan program to help bridge the gap for many in need as well. We have been active in the SBA’s Paycheck Protection Program assisting hundreds of businesses in accessing funding to support their operations during this unprecedented time. All of these efforts demonstrate our continued commitment to help those we serve manage through this crisis.”
“The Company entered this crisis with strong capital and liquidity that will support us as we move forward during these uncertain times,” added Justice.
Following is a discussion of the Corporation's financial performance as of, and for the quarter ended, March 31, 2020. At the end of this document is a list of abbreviations and acronyms.
Results of Operations
The following table outlines the Corporation's QTD results of operations and provides certain performance measures as of, and for the three month periods ended:
| 3/31/2020 | 12/31/2019 | 9/30/2019 | 6/30/2019 | 3/31/2019 | ||||||||||||||||
| INCOME STATEMENT DATA | ||||||||||||||||||||
| Interest income | $ | 11,070 | $ | 11,076 | $ | 11,240 | $ | 10,788 | $ | 10,437 | ||||||||||
| Interest expense | 2,145 | 2,158 | 2,184 | 2,195 | 2,090 | |||||||||||||||
| Net interest income | 8,925 | 8,918 | 9,056 | 8,593 | 8,347 | |||||||||||||||
| Provision for loan losses | 1,542 | 436 | 422 | 264 | 213 | |||||||||||||||
| Noninterest income | 4,513 | 2,129 | 2,262 | 2,250 | 1,522 | |||||||||||||||
| Noninterest expenses | 7,686 | 7,415 | 6,608 | 6,691 | 6,509 | |||||||||||||||
| Federal income tax expense | 858 | 644 | 873 | 791 | 633 | |||||||||||||||
| Net income | $ | 3,352 | $ | 2,552 | $ | 3,415 | $ | 3,097 | $ | 2,514 | ||||||||||
| PER SHARE | ||||||||||||||||||||
| Earnings | $ | 0.72 | $ | 0.55 | $ | 0.73 | $ | 0.67 | $ | 0.54 | ||||||||||
| Dividends | $ | 0.075 | $ | 0.07 | $ | 0.07 | $ | 0.07 | $ | 0.07 | ||||||||||
| Tangible book value(1) | $ | 21.56 | $ | 20.87 | $ | 20.37 | $ | 19.59 | $ | 18.88 | ||||||||||
| Quoted market value | ||||||||||||||||||||
| High | $ | 26.00 | $ | 25.50 | $ | 21.00 | $ | 21.00 | $ | 21.00 | ||||||||||
| Low | $ | 12.55 | $ | 20.60 | $ | 20.45 | $ | 20.45 | $ | 20.05 | ||||||||||
| Close(1) | $ | 15.50 | $ | 25.23 | $ | 21.00 | $ | 20.60 | $ | 20.89 | ||||||||||
| PERFORMANCE RATIOS | ||||||||||||||||||||
| Return on average assets | 1.28 | % | 1.02 | % | 1.40 | % | 1.31 | % | 1.09 | % | ||||||||||
| Return on average shareholders' equity | 13.01 | % | 10.03 | % | 13.83 | % | 13.14 | % | 11.09 | % | ||||||||||
| Return on average tangible shareholders' equity | 13.54 | % | 10.46 | % | 14.47 | % | 13.79 | % | 11.66 | % | ||||||||||
| Efficiency ratio | 57.20 | % | 67.12 | % | 58.38 | % | 61.71 | % | 65.95 | % | ||||||||||
| Yield on earning assets (FTE) | 4.47 | % | 4.66 | % | 4.85 | % | 4.81 | % | 4.77 | % | ||||||||||
| Rate on interest bearing liabilities | 1.28 | % | 1.36 | % | 1.42 | % | 1.46 | % | 1.40 | % | ||||||||||
| Net interest margin to earning assets (FTE) | 3.61 | % | 3.75 | % | 3.91 | % | 3.83 | % | 3.82 | % | ||||||||||
| BALANCE SHEET DATA(1) | ||||||||||||||||||||
| Total investment securities | $ | 76,312 | $ | 61,621 | $ | 62,351 | $ | 73,285 | $ | 82,222 | ||||||||||
| Gross loans | $ | 865,577 | $ | 870,555 | $ | 826,597 | $ | 813,547 | $ | 809,863 | ||||||||||
| Total assets | $ | 1,071,180 | $ | 1,034,759 | $ | 978,046 | $ | 949,790 | $ | 946,172 | ||||||||||
| Total deposits | $ | 883,837 | $ | 863,102 | $ | 801,101 | $ | 792,555 | $ | 789,533 | ||||||||||
| Borrowed funds | $ | 71,500 | $ | 61,500 | $ | 69,000 | $ | 54,000 | $ | 59,000 | ||||||||||
| Total shareholders' equity | $ | 104,828 | $ | 101,444 | $ | 99,142 | $ | 95,504 | $ | 92,236 | ||||||||||
| Net loans to total deposits | 97.11 | % | 100.19 | % | 102.51 | % | 102.02 | % | 101.97 | % | ||||||||||
| Common shares outstanding | 4,675,499 | 4,664,369 | 4,658,722 | 4,653,343 | 4,647,978 | |||||||||||||||
| QTD BALANCE SHEET AVERAGES | ||||||||||||||||||||
| Total assets | $ | 1,049,245 | $ | 994,094 | $ | 971,074 | $ | 947,095 | $ | 934,078 | ||||||||||
| Earning assets | $ | 997,089 | $ | 944,692 | $ | 920,857 | $ | 900,738 | $ | 887,974 | ||||||||||
| Interest bearing liabilities | $ | 672,564 | $ | 629,454 | $ | 611,804 | $ | 603,965 | $ | 604,973 | ||||||||||
| Total shareholders' equity | $ | 103,646 | $ | 100,991 | $ | 97,958 | $ | 94,519 | $ | 91,964 | ||||||||||
| Total tangible shareholders' equity | $ | 99,558 | $ | 96,796 | $ | 93,650 | $ | 90,098 | $ | 87,430 | ||||||||||
| Earned common shares outstanding | 4,659,279 | 4,652,569 | 4,646,835 | 4,641,161 | 4,635,255 | |||||||||||||||
| Unvested stock grants | 13,481 | 9,947 | 9,967 | 9,967 | 9,788 | |||||||||||||||
| Total common shares outstanding | 4,672,760 | 4,662,516 | 4,656,802 | 4,651,128 | 4,645,043 | |||||||||||||||
| ASSET QUALITY(1) | ||||||||||||||||||||
| Nonperforming loans to gross loans | 0.10 | % | 0.17 | % | 0.11 | % | 0.13 | % | 0.15 | % | ||||||||||
| Nonperforming assets to total assets | 0.12 | % | 0.14 | % | 0.09 | % | 0.11 | % | 0.13 | % | ||||||||||
| Allowance for loan losses to gross loans | 0.84 | % | 0.67 | % | 0.65 | % | 0.62 | % | 0.59 | % | ||||||||||
| CAPITAL RATIOS(1) | ||||||||||||||||||||
| Total capital to risk weighted assets | 14.42 | % | 14.03 | % | 14.42 | % | 14.18 | % | 13.99 | % | ||||||||||
| Tier 1 capital to risk weighted assets | 13.56 | % | 13.33 | % | 13.73 | % | 13.53 | % | 13.37 | % | ||||||||||
| CET1 capital to risk weighted assets | 11.91 | % | 11.64 | % | 11.96 | % | 11.73 | % | 11.54 | % | ||||||||||
| Tier 1 leverage ratio | 10.97 | % | 11.20 | % | 11.22 | % | 11.16 | % | 10.99 | % | ||||||||||
| (1)At end of period | ||||||||||||||||||||
The following table outlines the Corporation's YTD results of operations and provides certain performance measures as of, and for the three month periods ended:
| 3/31/2020 | 3/31/2019 | 3/31/2018 | 3/31/2017 | 3/31/2016 | ||||||||||||||||
| INCOME STATEMENT DATA | ||||||||||||||||||||
| Interest income | $ | 11,070 | $ | 10,437 | $ | 8,379 | $ | 6,427 | $ | 4,526 | ||||||||||
| Interest expense | 2,145 | 2,090 | 1,031 | 687 | 573 | |||||||||||||||
| Net interest income | 8,925 | 8,347 | 7,348 | 5,740 | 3,953 | |||||||||||||||
| Provision for loan losses | 1,542 | 213 | 275 | — | — | |||||||||||||||
| Noninterest income | 4,513 | 1,522 | 1,801 | 1,234 | 1,488 | |||||||||||||||
| Noninterest expenses | 7,686 | 6,509 | 6,279 | 5,095 | 4,046 | |||||||||||||||
| Federal income tax expense | 858 | 633 | 521 | 592 | 475 | |||||||||||||||
| Net income | $ | 3,352 | $ | 2,514 | $ | 2,074 | $ | 1,287 | $ | 920 | ||||||||||
| PER SHARE | ||||||||||||||||||||
| Earnings | $ | 0.72 | $ | 0.54 | $ | 0.57 | $ | 0.35 | $ | 0.36 | ||||||||||
| Dividends | $ | 0.075 | $ | 0.07 | $ | 0.06 | $ | 0.05 | $ | 0.25 | ||||||||||
| Tangible book value(1) | $ | 21.56 | $ | 18.88 | $ | 15.27 | $ | 12.86 | $ | 13.02 | ||||||||||
| Quoted market value | ||||||||||||||||||||
| High | $ | 26.00 | $ | 21.00 | $ | 20.19 | $ | 18.25 | $ | 14.94 | ||||||||||
| Low | $ | 12.55 | $ | 20.05 | $ | 18.88 | $ | 15.10 | $ | 13.70 | ||||||||||
| Close(1) | $ | 15.50 | $ | 20.89 | $ | 19.75 | $ | 18.00 | $ | 14.75 | ||||||||||
| PERFORMANCE RATIOS | ||||||||||||||||||||
| Return on average assets | 1.28 | % | 1.09 | % | 0.26 | % | 0.18 | % | 0.20 | % | ||||||||||
| Return on average shareholders' equity | 13.01 | % | 11.09 | % | 3.45 | % | 2.51 | % | 2.75 | % | ||||||||||
| Return on average tangible shareholders' equity | 13.54 | % | 11.66 | % | 3.45 | % | 2.51 | % | 2.75 | % | ||||||||||
| Efficiency ratio | 57.20 | % | 65.95 | % | 64.19 | % | 70.32 | % | 74.36 | % | ||||||||||
| Yield on earning assets (FTE) | 4.47 | % | 4.77 | % | 4.51 | % | 4.19 | % | 4.43 | % | ||||||||||
| Rate on interest bearing liabilities | 1.28 | % | 1.40 | % | 0.83 | % | 0.55 | % | 0.77 | % | ||||||||||
| Net interest margin to earning assets (FTE) | 3.61 | % | 3.82 | % | 3.90 | % | 3.74 | % | 3.87 | % | ||||||||||
| BALANCE SHEET DATA(1) | ||||||||||||||||||||
| Total investment securities | $ | 76,312 | $ | 82,222 | $ | 49,608 | $ | 72,472 | $ | 23,440 | ||||||||||
| Gross loans | $ | 865,577 | $ | 809,863 | $ | 686,140 | $ | 554,415 | $ | 386,685 | ||||||||||
| Total assets | $ | 1,071,180 | $ | 946,172 | $ | 789,943 | $ | 730,636 | $ | 455,603 | ||||||||||
| Total deposits | $ | 883,837 | $ | 789,533 | $ | 683,775 | $ | 630,055 | $ | 376,397 | ||||||||||
| Borrowed funds | $ | 71,500 | $ | 59,000 | $ | 44,600 | $ | 45,000 | $ | 44,775 | ||||||||||
| Total shareholders' equity | $ | 104,828 | $ | 92,236 | $ | 60,621 | $ | 51,816 | $ | 32,996 | ||||||||||
| Net loans to total deposits | 97.11 | % | 101.97 | % | 99.80 | % | 87.54 | % | 101.79 | % | ||||||||||
| Common shares outstanding | 4,675,499 | 4,647,978 | 3,635,098 | 3,620,964 | 2,534,255 | |||||||||||||||
| YTD BALANCE SHEET AVERAGES | ||||||||||||||||||||
| Total assets | $ | 1,049,245 | $ | 934,078 | $ | 789,391 | $ | 716,998 | $ | 456,730 | ||||||||||
| Earning assets | $ | 997,089 | $ | 887,974 | $ | 755,281 | $ | 613,904 | $ | 408,579 | ||||||||||
| Interest bearing liabilities | $ | 672,564 | $ | 604,973 | $ | 505,174 | $ | 499.636 | $ | 297.662 | ||||||||||
| Total shareholders' equity | $ | 103,646 | $ | 91,964 | $ | 60,107 | $ | 51,241 | $ | 33,445 | ||||||||||
| Total tangible shareholders' equity | $ | 99,558 | $ | 87,430 | $ | 55,041 | $ | 49,104 | $ | 33,445 | ||||||||||
| Earned common shares outstanding | 4,659,279 | 4,635,255 | 3,633,093 | 3,677,143 | 2,558,333 | |||||||||||||||
| Unvested stock grants | 13,481 | 9,788 | — | — | — | |||||||||||||||
| Total common shares outstanding | 4,672,760 | 4,645,043 | 3,633,093 | 3,677,143 | 2,558,333 | |||||||||||||||
| ASSET QUALITY(1) | ||||||||||||||||||||
| Nonperforming loans to gross loans | 0.10 | % | 0.15 | % | 0.10 | % | 0.33 | % | 0.06 | % | ||||||||||
| Nonperforming assets to total assets | 0.12 | % | 0.13 | % | 0.10 | % | 0.28 | % | 0.18 | % | ||||||||||
| Allowance for loan losses to gross loans | 0.84 | % | 0.59 | % | 0.54 | % | 0.52 | % | 0.92 | % | ||||||||||
| CAPITAL RATIOS(1) | ||||||||||||||||||||
| Total capital to risk weighted assets | 14.42 | % | 13.99 | % | 11.03 | % | 11.72 | % | 13.27 | % | ||||||||||
| Tier 1 capital to risk weighted assets | 13.56 | % | 13.37 | % | 10.48 | % | 11.20 | % | 12.33 | % | ||||||||||
| CET1 capital to risk weighted assets | 11.91 | % | 11.54 | % | 8.41 | % | 8.65 | % | 8.64 | % | ||||||||||
| Tier 1 leverage ratio | 10.97 | % | 10.99 | % | 9.01 | % | 8.60 | % | 10.43 | % | ||||||||||
| (1)At end of period | ||||||||||||||||||||
Income Statement Breakdown and Analysis
| Quarter to Date | ||||||||||||||||||||
| 3/31/2020 | 12/31/2019 | 9/30/2019 | 6/30/2019 | 3/31/2019 | ||||||||||||||||
| GAAP net income | $ | 3,352 | $ | 2,552 | $ | 3,415 | $ | 3,097 | $ | 2,514 | ||||||||||
| Acquisition related items (net of tax) | ||||||||||||||||||||
| Accretion on purchased loans | (180 | ) | (126 | ) | (189 | ) | (145 | ) | (175 | ) | ||||||||||
| Amortization of core deposit intangibles | 71 | 89 | 88 | 90 | 89 | |||||||||||||||
| Amortization on acquired time deposits | 5 | 7 | 7 | 7 | 7 | |||||||||||||||
| Amortization on purchased mortgage servicing rights | — | 3 | 3 | 3 | 3 | |||||||||||||||
| Total acquisition related items (net of tax) | (104 | ) | (27 | ) | (91 | ) | (45 | ) | (76 | ) | ||||||||||
| Other nonrecurring items (net of tax) | ||||||||||||||||||||
| Change in fair value of equity investment due to acquisition transaction | (578 | ) | — | — | — | — | ||||||||||||||
| Impact of adoption of SAB 109 | (976 | ) | — | — | — | — | ||||||||||||||
| Prepayment penalties collected | (36 | ) | (42 | ) | (284 | ) | (9 | ) | (13 | ) | ||||||||||
| Mortgage servicing rights impairment | 173 | — | — | — | — | |||||||||||||||
| Total other nonrecurring items (net of tax) | (1,417 | ) | (42 | ) | (284 | ) | (9 | ) | (13 | ) | ||||||||||
| Adjusted net income from operations | $ | 1,831 | $ | 2,483 | $ | 3,040 | $ | 3,043 | $ | 2,425 | ||||||||||
| GAAP net interest income | $ | 8,925 | $ | 8,918 | $ | 9,056 | $ | 8,593 | $ | 8,347 | ||||||||||
| Accretion on purchased loans | (228 | ) | (160 | ) | (239 | ) | (183 | ) | (222 | ) | ||||||||||
| Prepayment penalties collected | (46 | ) | (53 | ) | (360 | ) | (12 | ) | (16 | ) | ||||||||||
| Amortization on acquired time deposits | 6 | 9 | 9 | 9 | 9 | |||||||||||||||
| Adjusted net interest income | $ | 8,657 | $ | 8,714 | $ | 8,466 | $ | 8,407 | $ | 8,118 | ||||||||||
| PERFORMANCE RATIOS | ||||||||||||||||||||
| Based on adjusted net income from operations | ||||||||||||||||||||
| Earnings per share | $ | 0.39 | $ | 0.53 | $ | 0.65 | $ | 0.66 | $ | 0.52 | ||||||||||
| Return on average assets | 0.70 | % | 0.99 | % | 1.24 | % | 1.29 | % | 1.05 | % | ||||||||||
| Return on average shareholders' equity | 7.11 | % | 9.75 | % | 12.31 | % | 12.91 | % | 10.69 | % | ||||||||||
| Return on average tangible shareholders' equity | 7.40 | % | 10.18 | % | 12.88 | % | 13.55 | % | 11.25 | % | ||||||||||
| Based on adjusted net interest income | ||||||||||||||||||||
| Yield on earning assets (FTE) | 4.36 | % | 4.57 | % | 4.59 | % | 4.72 | % | 4.66 | % | ||||||||||
| Rate on interest bearing liabilities | 1.28 | % | 1.37 | % | 1.43 | % | 1.47 | % | 1.41 | % | ||||||||||
| Net interest margin to earning assets (FTE) | 3.50 | % | 3.66 | % | 3.66 | % | 3.75 | % | 3.72 | % | ||||||||||
| Year to Date March 31 | Variance | ||||||||||||||
| 2020 | 2019 | Amount | % | ||||||||||||
| GAAP net income | $ | 3,352 | $ | 2,514 | $ | 838 | 33.33 | % | |||||||
| Acquisition related items (net of tax) | |||||||||||||||
| Accretion on purchased loans | (180 | ) | (175 | ) | (5 | ) | 2.86 | % | |||||||
| Amortization of core deposit intangibles | 71 | 89 | (18 | ) | (20.22 | )% | |||||||||
| Amortization on acquired time deposits | 5 | 7 | (2 | ) | (28.57 | )% | |||||||||
| Amortization on purchased mortgage servicing rights | — | 3 | (3 | ) | (100.00 | )% | |||||||||
| Total acquisition related items (net of tax) | (104 | ) | (76 | ) | (28 | ) | 36.84 | % | |||||||
| Other nonrecurring items (net of tax) | |||||||||||||||
| Change in fair value of equity investment due to acquisition transaction | (578 | ) | — | (578 | ) | N/M | |||||||||
| Impact of adoption of SAB 109 | (976 | ) | — | (976 | ) | N/M | |||||||||
| Prepayment penalties collected | (36 | ) | (13 | ) | (23 | ) | 176.92 | % | |||||||
| Mortgage servicing rights impairment | 173 | — | 173 | N/M | |||||||||||
| Total other nonrecurring items (net of tax) | (1,417 | ) | (13 | ) | (1,404 | ) | 10,800.00 | % | |||||||
| Adjusted net income from operations | $ | 1,831 | $ | 2,425 | $ | (594 | ) | (24.49 | )% | ||||||
| GAAP net interest income | $ | 8,925 | $ | 8,347 | $ | 578 | 6.92 | % | |||||||
| Accretion on purchased loans | (228 | ) | (222 | ) | (6 | ) | 2.70 | % | |||||||
| Prepayment penalties collected | (46 | ) | (16 | ) | (30 | ) | 187.50 | % | |||||||
| Amortization on acquired time deposits | 6 | 9 | (3 | ) | (33.33 | )% | |||||||||
| Adjusted net interest income | $ | 8,657 | $ | 8,118 | $ | 539 | 6.64 | % | |||||||
| PERFORMANCE RATIOS | |||||||||||||||
| Based on adjusted net income from operations | |||||||||||||||
| Earnings per share | $ | 0.39 | $ | 0.52 | $ | (0.13 | ) | (25.00 | )% | ||||||
| Return on average assets | 0.70 | % | 1.05 | % | (0.35 | )% | |||||||||
| Return on average shareholders' equity | 7.11 | % | 10.69 | % | (3.58 | )% | |||||||||
| Return on average tangible shareholders' equity | 7.40 | % | 11.25 | % | (3.85 | )% | |||||||||
| Based on adjusted net interest income | |||||||||||||||
| Yield on earning assets (FTE) | 4.36 | % | 4.66 | % | (0.30 | )% | |||||||||
| Rate on interest bearing liabilities | 1.28 | % | 1.41 | % | (0.13 | )% | |||||||||
| Net interest margin to earning assets (FTE) | 3.50 | % | 3.72 | % | (0.22 | )% | |||||||||
To effectively compare core operating results from period to period, the impact of acquisition related items and other nonrecurring items have been isolated.
The Corporation adopted Staff Accounting Bulletin No. 109 as of January 1, 2020. This standard required the Corporation to record interest rate lock commitments, forward loan sales commitments, and loans held for sale at fair value. Changes in the fair value of these instruments is recognized as a component of noninterest income. As forward loan sales commitments were previously recorded at fair value, the nonrecurring item impact disclosed above represents the change in fair value of interest rate lock commitments and loans held for sale.
Average Balances, Interest Rate, and Net Interest Income
The following tables present the daily average amount outstanding for each major category of interest earning assets, nonearning assets, interest bearing liabilities, and noninterest bearing liabilities. These tables also present an analysis of interest income and interest expense for the periods indicated. All interest income is reported on a FTE basis using a federal income tax rate of 21%. Loans in nonaccrual status, for the purpose of the following computations, are included in the average loan balances.
| Three Months Ended | ||||||||||||||||||||||||||||||||||||||||||||||||
| March 31, 2020 | December 31, 2019 | March 31, 2019 | ||||||||||||||||||||||||||||||||||||||||||||||
| Average Balance |
Tax Equivalent Interest |
Average Yield / Rate |
Average Balance |
Tax Equivalent Interest |
Average Yield / Rate |
Average Balance |
Tax Equivalent Interest |
Average Yield / Rate |
||||||||||||||||||||||||||||||||||||||||
| Interest earning assets | ||||||||||||||||||||||||||||||||||||||||||||||||
| Total loans | $ | 878,813 | $ | 10,481 | 4.80 | % | $ | 857,474 | $ | 10,581 | 4.90 | % | $ | 791,069 | $ | 9,741 | 4.99 | % | ||||||||||||||||||||||||||||||
| Taxable investment securities | 56,963 | 353 | 2.49 | % | 49,982 | 307 | 2.44 | % | 79,367 | 559 | 2.86 | % | ||||||||||||||||||||||||||||||||||||
| Nontaxable investment securities | 10,532 | 81 | 3.09 | % | 10,366 | 80 | 3.06 | % | 10,582 | 76 | 2.91 | % | ||||||||||||||||||||||||||||||||||||
| Federal funds sold | 33,588 | 116 | 1.39 | % | 16,833 | 66 | 1.56 | % | 43 | — | — | % | ||||||||||||||||||||||||||||||||||||
| Interest earning cash and cash equivalents | 14,043 | 26 | 0.74 | % | 6,887 | 28 | 1.61 | % | 3,763 | 25 | 2.69 | % | ||||||||||||||||||||||||||||||||||||
| Federal Home Loan Bank stock | 3,150 | 30 | 3.83 | % | 3,150 | 31 | 3.90 | % | 3,150 | 52 | 6.69 | % | ||||||||||||||||||||||||||||||||||||
| Total earning assets | 997,089 | 11,087 | 4.47 | % | 944,692 | 11,093 | 4.66 | % | 887,974 | 10,453 | 4.77 | % | ||||||||||||||||||||||||||||||||||||
| Nonearning assets | ||||||||||||||||||||||||||||||||||||||||||||||||
| Allowance for loan losses | (5,821 | ) | (5,519 | ) | (4,591 | ) | ||||||||||||||||||||||||||||||||||||||||||
| Fixed assets | 15,538 | 15,395 | 14,818 | |||||||||||||||||||||||||||||||||||||||||||||
| Accrued income and other assets | 42,439 | 39,526 | 35,877 | |||||||||||||||||||||||||||||||||||||||||||||
| Total assets | $ | 1,049,245 | $ | 994,094 | $ | 934,078 | ||||||||||||||||||||||||||||||||||||||||||
| Interest bearing liabilities | ||||||||||||||||||||||||||||||||||||||||||||||||
| Interest bearing demand deposits | $ | 170,598 | $ | 475 | 1.12 | % | $ | 140,368 | $ | 410 | 1.16 | % | $ | 73,414 | $ | 84 | 0.46 | % | ||||||||||||||||||||||||||||||
| Savings deposits | 231,188 | 199 | 0.35 | % | 225,219 | 217 | 0.38 | % | 241,815 | 297 | 0.50 | % | ||||||||||||||||||||||||||||||||||||
| Time deposits | 205,485 | 1,053 | 2.06 | % | 201,640 | 1,089 | 2.14 | % | 225,866 | 1,220 | 2.19 | % | ||||||||||||||||||||||||||||||||||||
| Borrowed funds | 65,293 | 418 | 2.57 | % | 62,227 | 442 | 2.82 | % | 63,878 | 489 | 3.10 | % | ||||||||||||||||||||||||||||||||||||
| Total interest bearing liabilities | 672,564 | 2,145 | 1.28 | % | 629,454 | 2,158 | 1.36 | % | 604,973 | 2,090 | 1.40 | % | ||||||||||||||||||||||||||||||||||||
| Noninterest bearing liabilities | ||||||||||||||||||||||||||||||||||||||||||||||||
| Noninterest bearing deposits | 264,699 | 254,858 | 234,268 | |||||||||||||||||||||||||||||||||||||||||||||
| Accrued interest and other liabilities | 8,336 | 8,791 | 2,873 | |||||||||||||||||||||||||||||||||||||||||||||
| Shareholders' equity | 103,646 | 100,991 | 91,964 | |||||||||||||||||||||||||||||||||||||||||||||
| Total liabilities and shareholders' equity | $ | 1,049,245 | $ | 994,094 | $ | 934,078 | ||||||||||||||||||||||||||||||||||||||||||
| Net interest income (FTE) | $ | 8,942 | $ | 8,935 | $ | 8,363 | ||||||||||||||||||||||||||||||||||||||||||
| Net interest margin to earning assets (FTE) | 3.61 | % | 3.75 | % | 3.82 | % | ||||||||||||||||||||||||||||||||||||||||||
Net Interest Income
Net interest income is the amount by which interest income on earning assets exceeds the interest expenses on interest bearing liabilities. Net interest income, which includes loan fees, is influenced by changes in the balance and mix of assets and liabilities and market interest rates. The Corporation exerts some control over these factors; however, FRB monetary policy and competition have a significant impact. For analytical purposes, net interest income is adjusted to a FTE basis by adding the income tax savings from interest on tax exempt loans, and nontaxable investment securities, thus making year-to-year comparisons more meaningful.
Volume and Rate Variance Analysis
The following table sets forth the effect of volume and rate changes on interest income and expense for the periods indicated. For the purpose of this table, changes in interest due to volume and rate were determined as follows:
Volume - change in volume multiplied by the previous period's rate.
Rate - change in the FTE rate multiplied by the previous period's volume.
The change in interest due to both volume and rate has been allocated to volume and rate changes in proportion to the relationship of the absolute dollar amounts of the change in each.
| Three Months Ended | Three Months Ended | |||||||||||||||||||||||
| March 31, 2020 | March 31, 2020 | |||||||||||||||||||||||
| Compared To | Compared To | |||||||||||||||||||||||
| December 31, 2019 | March 31, 2019 | |||||||||||||||||||||||
| Increase (Decrease) Due to | Increase (Decrease) Due to | |||||||||||||||||||||||
| Volume | Rate | Net | Volume | Rate | Net | |||||||||||||||||||
| Changes in interest income | ||||||||||||||||||||||||
| Total loans | $ | 887 | $ | (987 | ) | $ | (100 | ) | $ | 2,789 | $ | (2,049 | ) | $ | 740 | |||||||||
| Taxable investment securities | 40 | 6 | 46 | (141 | ) | (65 | ) | (206 | ) | |||||||||||||||
| Nontaxable investment securities | 1 | — | 1 | (2 | ) | 7 | 5 | |||||||||||||||||
| Federal funds sold | 97 | (47 | ) | 50 | — | 116 | 116 | |||||||||||||||||
| Interest earning cash and cash equivalents | 78 | (80 | ) | (2 | ) | 116 | (115 | ) | 1 | |||||||||||||||
| Federal Home Loan Bank stock | — | (1 | ) | (1 | ) | — | (22 | ) | (22 | ) | ||||||||||||||
| Total changes in interest income | 1,103 | (1,109 | ) | (6 | ) | 2,762 | (2,128 | ) | 634 | |||||||||||||||
| Changes in interest expense | ||||||||||||||||||||||||
| Interest bearing demand deposits | 153 | (88 | ) | 65 | 188 | 203 | 391 | |||||||||||||||||
| Savings deposits | 30 | (48 | ) | (18 | ) | (12 | ) | (86 | ) | (98 | ) | |||||||||||||
| Time deposits | 97 | (133 | ) | (36 | ) | (101 | ) | (66 | ) | (167 | ) | |||||||||||||
| Borrowed funds | 102 | (126 | ) | (24 | ) | 70 | (141 | ) | (71 | ) | ||||||||||||||
| Total changes in interest expense | 382 | (395 | ) | (13 | ) | 145 | (90 | ) | 55 | |||||||||||||||
| Net change in net interest income (FTE) | $ | 721 | $ | (714 | ) | $ | 7 | $ | 2,617 | $ | (2,038 | ) | $ | 579 | ||||||||||
| Average Yield/Rate for the Three Month Periods Ended | ||||||||||||||||||||||||||||||||
| 3/31/2020 | 12/31/2019 | 9/30/2019 | 6/30/2019 | 3/31/2019 | ||||||||||||||||||||||||||||
| Total earning assets | 4.47 | % | 4.66 | % | 4.85 | % | 4.81 | % | 4.77 | % | ||||||||||||||||||||||
| Total interest bearing liabilities | 1.28 | % | 1.36 | % | 1.42 | % | 1.46 | % | 1.40 | % | ||||||||||||||||||||||
| Net interest margin to earning assets (FTE) | 3.61 | % | 3.75 | % | 3.91 | % | 3.83 | % | 3.82 | % | ||||||||||||||||||||||
| Quarter to Date Net Interest Income (FTE) | ||||||||||||||||||||
| 3/31/2020 | 12/31/2019 | 9/30/2019 | 6/30/2019 | 3/31/2019 | ||||||||||||||||
| Interest income | $ | 11,070 | $ | 11,076 | $ | 11,240 | $ | 10,788 | $ | 10,437 | ||||||||||
| FTE adjustment | 17 | 17 | 15 | 15 | 16 | |||||||||||||||
| Total interest income (FTE) | 11,087 | 11,093 | 11,255 | 10,803 | 10,453 | |||||||||||||||
| Total interest expense | 2,145 | 2,158 | 2,184 | 2,195 | 2,090 | |||||||||||||||
| Net interest income (FTE) | $ | 8,942 | $ | 8,935 | $ | 9,071 | $ | 8,608 | $ | 8,363 | ||||||||||
The current interest rate environment continues to create pressure on the Corporation's net interest margin. While the Corporation was able to increase net interest income for the quarter ended March 31, 2020 compared to the quarter ended December 31, 2019, the increase was not as significant as previous quarters.
In the first quarter of 2020, the Corporation made a concentrated effort to sharply decrease the interest rates on deposit products paying interest rates that were above the offered rates available in the market. Net interest margins are expected to compress throughout 2020 as rates on interest earning assets are expected to continue to fall faster than interest bearing liabilities.
Noninterest Income
| Quarter to Date | ||||||||||||||||||||
| 3/31/2020 | 12/31/2019 | 9/30/2019 | 6/30/2019 | 3/31/2019 | ||||||||||||||||
| Net gain on sales of mortgage loans | $ | 970 | $ | 650 | $ | 665 | $ | 422 | $ | 195 | ||||||||||
| Change in fair value of mortgage banking hedge instruments | 833 | — | — | — | — | |||||||||||||||
| Change in fair value of equity investments | 749 | (5 | ) | 16 | 21 | 14 | ||||||||||||||
| Net gain on sales of commercial loans | 668 | — | — | — | — | |||||||||||||||
| Trust and investment services | 389 | 337 | 395 | 459 | 328 | |||||||||||||||
| ATM and debit card income | 355 | 399 | 418 | 404 | 360 | |||||||||||||||
| Mortgage servicing fees | 262 | 256 | 243 | 230 | 211 | |||||||||||||||
| Service charges on deposit accounts | 219 | 245 | 239 | 222 | 234 | |||||||||||||||
| Net mortgage servicing rights income | (50 | ) | 130 | 142 | 344 | 8 | ||||||||||||||
| Other income and fees | 118 | 117 | 144 | 148 | 172 | |||||||||||||||
| Total noninterest income | $ | 4,513 | $ | 2,129 | $ | 2,262 | $ | 2,250 | $ | 1,522 | ||||||||||
| Year to Date March 31 | Variance | ||||||||||||||
| 2020 | 2019 | Amount | % | ||||||||||||
| Net gain on sales of mortgage loans | $ | 970 | $ | 195 | $ | 775 | 397.44 | % | |||||||
| Change in fair value of mortgage banking hedge instruments | 833 | — | 833 | N/M | |||||||||||
| Change in fair value of equity investments | 749 | 14 | 735 | 5250.00 | % | ||||||||||
| Net gain on sales of commercial loans | 668 | — | 668 | N/M | |||||||||||
| Trust and investment services | 389 | 328 | 61 | 18.60 | % | ||||||||||
| ATM and debit card income | 355 | 360 | (5 | ) | (1.39 | )% | |||||||||
| Mortgage servicing fees | 262 | 211 | 51 | 24.17 | % | ||||||||||
| Service charges on deposit accounts | 219 | 234 | (15 | ) | (6.41 | )% | |||||||||
| Net mortgage servicing rights income | (50 | ) | 8 | (58 | ) | (725.00 | )% | ||||||||
| Other income and fees | 118 | 172 | (54 | ) | (31.40 | )% | |||||||||
| Total noninterest income | $ | 4,513 | $ | 1,522 | $ | 2,991 | 196.52 | % | |||||||
Net gain on sales of mortgage loans represents the income earned on the sale of residential mortgage loans into the secondary market. During 2019, and into 2020, the interest rate environment was very advantageous for residential mortgage originations and refinancing. While the interest rate environment is historically attractive for residential mortgage origination, the uncertainty that many consumers are facing due to the COVID-19 global pandemic is expected to reduce residential mortgage originations. As such, gains from the sales of mortgage loans are expected to decrease through 2020.
On January 1, 2020, the Corporation adopted SAB 109. Because of this adoption, the Corporation now recognizes the value of servicing at the time of commitment, which resulted in an increase in retained earnings of $78 at January 1, 2020. The Corporation also elected the fair value option for its residential mortgage loans HFS on January 1, 2020, which resulted in an increase in retained earnings of $436. Pursuant to this adoption, changes in the fair value of mortgage banking hedge instruments and loans held for sale are included in noninterest income.
Change in fair value of equity investments represents the income earned on equities held in the Corporation's investment portfolio. During the first quarter of 2020, an equity position held by the Corporation was bought out through an acquisition, and that transaction generated a gain of $732. The Corporation does not anticipate any significant changes in fair value from equity sales throughout the remainder of 2020.
Net gain on sales of commercial loans includes the income earned on the sale of commercial loans into the secondary market. During the first quarter of 2020, the Corporation sold the guaranteed portion of one SBA loan and one USDA loan. The Corporation continually analyzes its commercial loan portfolio for opportunistic sales strategies.
Trust and investment services includes income the Corporation earned from contracts with customers to manage assets for investment and/or to transact on their accounts. The wealth management component is strongly correlated to changes in the stock market and as such, can vary from period to period. Trust and investment services income is expected to approximate current levels throughout the remainder of the year.
ATM and debit card income represents fees earned on ATM and debit card transactions. The Corporation expects these fees to increase modestly throughout the remainder of 2020.
Mortgage servicing fees includes the fees earned for servicing loans that have been sold into the secondary market. The increase in mortgage servicing fees is directly related to the increases in the size of the serviced portfolio. Mortgage servicing fees are expected to continue to increase throughout the year.
Service charges on deposit accounts includes fees earned from deposit customers for transaction-based, account maintenance and overdraft services. The year-over-year decrease in service charges on deposit accounts is a result of a decline in NSF fees as well as a shift of customer demand toward deposit accounts with no or reduced service charges. In order to provide relief to customers during the COVID-19 global pandemic, the Corporation reduced fees charged on NSF transactions by more than 50%. This reduction in fees runs through May 31, 2020. For these reasons, service charges on deposit accounts are expected to decrease in the foreseeable future.
Net mortgage servicing rights income represents income generated from the capitalization of mortgage servicing rights, net of amortization. During the second quarter of 2019, the Corporation sold a pool of residential mortgage loans out of its loan portfolio, but retained servicing. This sale generated $266 of net MSR income. During the first quarter of 2020, the Corporation recognized an impairment on the MSR portfolio of $219. This impairment was recognized due to the fact that the MSR portfolio had a carrying balance that was larger than the value produced by a forecasting model. The model that was used is produced by a third-party consultant, and uses proprietary analytical tools to calculates unique present values of expected future cash flows. This cash flow analysis is calculated by pooling loans into homogeneous characteristics. The impairment recognized is attributable to the pool of loans with an original term of 30 years. The Corporation also decreased the rates at which MSR are capitalized so as to reflect more accurate fair value. The Corporation expects net MSR income to slightly decrease in 2020 due to the decreased rates that MSR are capitalized at and slowing residential mortgage loan origination.
Other income and fees includes other income items, none of which are individually significant. Other income and fees are expected to approximate current levels throughout 2020.
Noninterest Expenses
| Quarter to Date | ||||||||||||||||||||
| 3/31/2020 | 12/31/2019 | 9/30/2019 | 6/30/2019 | 3/31/2019 | ||||||||||||||||
| Total compensation | $ | 4,248 | $ | 4,037 | $ | 3,530 | $ | 3,749 | $ | 3,630 | ||||||||||
| Furniture and equipment | 610 | 665 | 579 | 525 | 491 | |||||||||||||||
| Professional services | 522 | 582 | 494 | 439 | 445 | |||||||||||||||
| Occupancy | 476 | 467 | 444 | 426 | 437 | |||||||||||||||
| Data processing | 442 | 272 | 323 | 281 | 278 | |||||||||||||||
| Advertising and promotional | 252 | 232 | 222 | 291 | 163 | |||||||||||||||
| Loan and collection | 162 | 203 | 120 | 119 | 110 | |||||||||||||||
| ATM and debit card | 108 | 98 | 109 | 100 | 95 | |||||||||||||||
| Telephone and communication | 96 | 115 | 110 | 108 | 111 | |||||||||||||||
| Amortization of core deposit intangibles | 90 | 113 | 112 | 114 | 112 | |||||||||||||||
| FDIC insurance premiums | 55 | 6 | 20 | 17 | 101 | |||||||||||||||
| Other general and administrative | 625 | 625 | 545 | 522 | 536 | |||||||||||||||
| Total noninterest expenses | $ | 7,686 | $ | 7,415 | $ | 6,608 | $ | 6,691 | $ | 6,509 | ||||||||||
| Year to Date March 31 | Variance | ||||||||||||||
| 2020 | 2019 | Amount | % | ||||||||||||
| Total compensation | $ | 4,248 | $ | 3,630 | $ | 618 | 17.02 | % | |||||||
| Furniture and equipment | 610 | 491 | 119 | 24.24 | % | ||||||||||
| Professional services | 522 | 445 | 77 | 17.30 | % | ||||||||||
| Occupancy | 476 | 437 | 39 | 8.92 | % | ||||||||||
| Data processing | 442 | 278 | 164 | 58.99 | % | ||||||||||
| Advertising and promotional | 252 | 163 | 89 | 54.60 | % | ||||||||||
| Loan and collection | 162 | 110 | 52 | 47.27 | % | ||||||||||
| ATM and debit card | 108 | 95 | 13 | 13.68 | % | ||||||||||
| Telephone and communication | 96 | 111 | (15 | ) | (13.51 | )% | |||||||||
| Amortization of core deposit intangibles | 90 | 112 | (22 | ) | (19.64 | )% | |||||||||
| FDIC insurance premiums | 55 | 101 | (46 | ) | (45.54 | )% | |||||||||
| Other general and administrative | 625 | 536 | 89 | 16.60 | % | ||||||||||
| Total noninterest expenses | $ | 7,686 | $ | 6,509 | $ | 1,177 | 18.08 | % | |||||||
Total compensation includes salaries, commissions and incentives, employee benefits, and payroll taxes. Total compensation has increased due to annual merit increases and an increase in commissions and incentives paid. Fluctuations in commissions and incentives are primarily driven by residential mortgage originations, which can vary significantly from period to period. Total compensation is expected to continue to increase modestly throughout 2020 as increases related to the growth in size and complexity of the Corporation will likely be offset by reductions in commissions and incentives.
Furniture and equipment and occupancy expenses primarily consist of depreciation, repairs and maintenance, property taxes, utilities, insurance, certain service contracts, and other related items. These expenses are expected to increase with the size and complexity of the Corporation.
Professional services include expenses relating to third-party professional services. These services include, but are not limited to, regulatory, auditing, consulting, and legal. These expenses are expected to increase in future periods to ensure compliance with audit and regulatory requirements.
Data processing primarily includes the expenses relating to the Corporation's core data processor. These expenses are expected to increase throughout 2020 with the size and complexity of the Corporation.
Advertising and promotional includes the Corporation's media costs and any donations or sponsorships made on behalf of the Corporation. The increase in expenses is a direct result of the Corporation enhancing its marketing efforts to attract new and expand existing customer loans and deposit accounts. These expenses are expected to increase throughout 2020 due to the Corporation's re-branding strategy and continued growth strategy.
Loan and collection includes expenses related to the origination and collection of loans, as well as expenses related to OREO. Given the impact that COVID-19 has had on the economy, the Corporation may experience elevated levels of these expenses in 2020.
ATM and debit card expenses fluctuate based on customer and non-customer utilization of ATMs and customer debit card volumes. The Corporation expects these fees to increase modestly throughout 2020.
Telephone and communication includes expenses relating to the Corporation's communication systems. These expenses are expected to maintain current levels for the remainder of 2020.
Amortization of core deposit intangibles relates to the core deposits acquired from Community Bancorp, Inc. on December 31, 2016 and is expected to approximate current levels throughout 2020.
FDIC insurance premiums typically fluctuate based on the size of the Corporation's balance sheet, capital position, overall risk profile, and examination ratings. FDIC insurance premiums decreased significantly in 2019 due to a Small Bank Assessment Credit issued by the FDIC in the second quarter of 2019. The credit was fully applied during the first quarter of 2020. Due to the application of the Small Bank Assessment Credit, FDIC insurance premiums are not expected to increase in 2020.
Other general and administrative includes miscellaneous other expense items, none of which are individually significant. These expenses are expected to approximate current levels into the foreseeable future.
Balance Sheet Breakdown and Analysis
| 3/31/2020 | 12/31/2019 | 9/30/2019 | 6/30/2019 | 3/31/2019 | ||||||||||||||||
| ASSETS | ||||||||||||||||||||
| Cash and cash equivalents | $ | 71,140 | $ | 46,803 | $ | 37,572 | $ | 20,067 | $ | 16,509 | ||||||||||
| Total investment securities | 76,312 | 61,621 | 62,351 | 73,285 | 82,222 | |||||||||||||||
| Loans held-for-sale | 21,154 | 19,491 | 15,111 | 6,771 | 1,835 | |||||||||||||||
| Gross loans | 865,577 | 870,555 | 826,597 | 813,547 | 809,863 | |||||||||||||||
| Less allowance for loan losses | 7,250 | 5,813 | 5,413 | 5,014 | 4,745 | |||||||||||||||
| Net loans | 858,327 | 864,742 | 821,184 | 808,533 | 805,118 | |||||||||||||||
| All other assets | 44,247 | 42,102 | 41,828 | 41,134 | 40,488 | |||||||||||||||
| Total assets | $ | 1,071,180 | $ | 1,034,759 | $ | 978,046 | $ | 949,790 | $ | 946,172 | ||||||||||
| LIABILITIES AND SHAREHOLDERS' EQUITY | ||||||||||||||||||||
| Total deposits | $ | 883,837 | $ | 863,102 | $ | 801,101 | $ | 792,555 | $ | 789,533 | ||||||||||
| Total borrowed funds | 71,500 | 61,500 | 69,000 | 54,000 | 59,000 | |||||||||||||||
| Accrued interest payable and other liabilities | 11,015 | 8,713 | 8,803 | 7,731 | 5,403 | |||||||||||||||
| Total liabilities | 966,352 | 933,315 | 878,904 | 854,286 | 853,936 | |||||||||||||||
| Total shareholders' equity | 104,828 | 101,444 | 99,142 | 95,504 | 92,236 | |||||||||||||||
| Total liabilities and shareholders' equity | $ | 1,071,180 | $ | 1,034,759 | $ | 978,046 | $ | 949,790 | $ | 946,172 | ||||||||||
| 3/31/2020 vs 12/31/2019 | 3/31/2020 vs 3/31/2019 | |||||||||||||
| Variance | Variance | |||||||||||||
| Amount | % | Amount | % | |||||||||||
| ASSETS | ||||||||||||||
| Cash and cash equivalents | $ | 24,337 | 52.00 | % | $ | 54,631 | 330.92 | % | ||||||
| Total investment securities | 14,691 | 23.84 | % | (5,910 | ) | (7.19 | )% | |||||||
| Loans held-for-sale | 1,663 | 8.53 | % | 19,319 | 1,052.81 | % | ||||||||
| Gross loans | (4,978 | ) | (0.57 | )% | 55,714 | 6.88 | % | |||||||
| Less allowance for loan losses | 1,437 | 24.72 | % | 2,505 | 52.79 | % | ||||||||
| Net loans | (6,415 | ) | (0.74 | )% | 53,209 | 6.61 | % | |||||||
| All other assets | 2,145 | 5.09 | % | 3,759 | 9.28 | % | ||||||||
| Total assets | $ | 36,421 | 3.52 | % | $ | 125,008 | 13.21 | % | ||||||
| LIABILITIES AND SHAREHOLDERS' EQUITY | ||||||||||||||
| Total deposits | $ | 20,735 | 2.40 | % | $ | 94,304 | 11.94 | % | ||||||
| Total borrowed funds | 10,000 | 16.26 | % | 12,500 | 21.19 | % | ||||||||
| Accrued interest payable and other liabilities | 2,302 | 26.42 | % | 5,612 | 103.87 | % | ||||||||
| Total liabilities | 33,037 | 1.84 | % | 112,416 | 6.84 | % | ||||||||
| Total shareholders' equity | 3,384 | 3.34 | % | 12,592 | 13.65 | % | ||||||||
| Total liabilities and shareholders' equity | $ | 36,421 | 3.52 | % | $ | 125,008 | 13.21 | % | ||||||
Cash and cash equivalents
| 3/31/2020 | 12/31/2019 | 9/30/2019 | 6/30/2019 | 3/31/2019 | ||||||||||||||||
| Cash and due from banks | ||||||||||||||||||||
| Noninterest bearing | $ | 33,312 | $ | 17,754 | $ | 21,808 | $ | 12,143 | $ | 7,683 | ||||||||||
| Interest bearing | 37,828 | 6,049 | 6,764 | 4,924 | 8,826 | |||||||||||||||
| Federal funds sold | — | 23,000 | 9,000 | 3,000 | — | |||||||||||||||
| Cash and cash equivalents | $ | 71,140 | $ | 46,803 | $ | 37,572 | $ | 20,067 | $ | 16,509 | ||||||||||
| 3/31/2020 vs 12/31/2019 | 3/31/2020 vs 3/31/2019 | |||||||||||||||||||
| Variance | Variance | |||||||||||||||||||
| Amount | % | Amount | % | |||||||||||||||||
| Cash and due from banks | ||||||||||||||||||||
| Noninterest bearing | $ | 15,558 | 87.63 | % | $ | 25,629 | 333.58 | % | ||||||||||||
| Interest bearing | 31,779 | 525.36 | % | 29,002 | 328.60 | % | ||||||||||||||
| Federal funds sold | (23,000 | ) | (100.00 | )% | — | N/M | ||||||||||||||
| Cash and cash equivalents | $ | 24,337 | 52.00 | % | $ | 54,631 | 330.92 | % | ||||||||||||
Cash and cash equivalents, which is comprised of cash and due from banks and federal funds sold, fluctuate from period to period based on loan demand and variances in deposit accounts. Federal funds sold increased in the fourth quarter of 2019 compared to that year's third quarter due to an increase in total deposits. Towards the end of the first quarter of 2020, the Corporation shifted funds from federal funds sold to cash and due from banks as those accounts were yielding a higher interest rate. The overall increase in cash and cash equivalents from the fourth quarter of 2019 to the first quarter of 2020 is largely due to an increase in total deposits. The Corporation expects to fund investment security growth and PPP loans with cash and cash equivalents.
Primary and secondary liquidity sources
While the Corporation continues to have strong cash and cash equivalents, it is important to monitor all sources of liquidity. Because of the volume of PPP loans, the Corporation may have to make significant draws on these sources of liquidity in the near term. The following table outlines the Corporation's primary and secondary sources of liquidity as of:
| 3/31/2020 | 12/31/2019 | 9/30/2019 | 6/30/2019 | 3/31/2019 | ||||||||||||||||
| Cash and cash equivalents | $ | 71,140 | $ | 46,803 | $ | 37,572 | $ | 20,067 | $ | 16,509 | ||||||||||
| Unpledged investment securities | 51,889 | 40,094 | 40,675 | 50,729 | 60,032 | |||||||||||||||
| FHLB borrowing availability | 42,500 | 52,500 | 45,000 | 60,000 | 60,000 | |||||||||||||||
| Federal funds purchased lines of credit | 17,500 | 17,500 | 17,500 | 17,500 | 12,500 | |||||||||||||||
| Funds available through the Fed Discount Window | 10,000 | 10,000 | 10,000 | 10,000 | 10,000 | |||||||||||||||
| Total liquidity sources | $ | 193,029 | $ | 166,897 | $ | 150,747 | $ | 158,296 | $ | 159,041 | ||||||||||
Total investment securities
| 3/31/2020 | 12/31/2019 | 9/30/2019 | 6/30/2019 | 3/31/2019 | ||||||||||||||||
| Available-for-sale | ||||||||||||||||||||
| U.S. Government and federal agency | $ | 23,610 | $ | 18,867 | $ | 22,854 | $ | 33,842 | $ | 38,796 | ||||||||||
| State and municipal | 10,657 | 10,691 | 10,194 | 8,889 | 10,322 | |||||||||||||||
| Mortgage backed residential | 10,176 | 10,748 | 6,227 | 6,733 | 7,031 | |||||||||||||||
| Certificates of deposit | 8,644 | 6,659 | 7,155 | 7,154 | 8,394 | |||||||||||||||
| Collateralized mortgage obligations - agencies | 18,288 | 9,527 | 10,826 | 11,856 | 12,516 | |||||||||||||||
| Unrealized gain/(loss) on available-for-sale securities | 1,735 | 1,092 | 1,048 | 776 | 288 | |||||||||||||||
| Total available-for-sale | 73,110 | 57,584 | 58,304 | 69,250 | 77,347 | |||||||||||||||
| Held-to-maturity state and municipal | 2,091 | 2,096 | 2,100 | 2,104 | 2,965 | |||||||||||||||
| Equity securities | 1,111 | 1,941 | 1,947 | 1,931 | 1,910 | |||||||||||||||
| Total investment securities | $ | 76,312 | $ | 61,621 | $ | 62,351 | $ | 73,285 | $ | 82,222 | ||||||||||
| 3/31/2020 vs 12/31/2019 | 3/31/2020 vs 3/31/2019 | |||||||||||||||||||
| Variance | Variance | |||||||||||||||||||
| Amount | % | Amount | % | |||||||||||||||||
| Available-for-sale | ||||||||||||||||||||
| U.S. Government and federal agency | $ | 4,743 | 25.14 | % | $ | (15,186 | ) | (39.14 | )% | |||||||||||
| State and municipal | (34 | ) | (0.32 | )% | 335 | 3.25 | % | |||||||||||||
| Mortgage backed residential | (572 | ) | (5.32 | )% | 3,145 | 44.73 | % | |||||||||||||
| Certificates of deposit | 1,985 | 29.81 | % | 250 | 2.98 | % | ||||||||||||||
| Collateralized mortgage obligations - agencies | 8,761 | 91.96 | % | 5,772 | 46.12 | % | ||||||||||||||
| Unrealized gain/(loss) on available-for-sale securities | 643 | 58.88 | % | 1,447 | 502.43 | % | ||||||||||||||
| Total available-for-sale | 15,526 | 26.96 | % | (4,237 | ) | (5.48 | )% | |||||||||||||
| Held-to-maturity state and municipal | (5 | ) | (0.24 | )% | (874 | ) | (29.48 | )% | ||||||||||||
| Equity securities | (830 | ) | (42.76 | )% | (799 | ) | (41.83 | )% | ||||||||||||
| Total investment securities | $ | 14,691 | 23.84 | % | $ | (5,910 | ) | (7.19 | )% | |||||||||||
The amortized cost and fair value of AFS investment securities as of March 31, 2020 were as follows:
| Maturing | ||||||||||||||||||||||||
| Due in One Year or Less |
After One Year But Within Five Years |
After Five Years But Within Ten Years |
After Ten Years | Securities with Variable Monthly Payments or Noncontractual Maturities |
Total | |||||||||||||||||||
| U.S. Government and federal agency | $ | 18,692 | $ | 4,918 | $ | — | $ | — | $ | — | $ | 23,610 | ||||||||||||
| State and municipal | 3,380 | 4,663 | 1,379 | 1,235 | — | 10,657 | ||||||||||||||||||
| Mortgage backed residential | — | — | — | — | 10,176 | 10,176 | ||||||||||||||||||
| Certificates of deposit | 4,454 | 4,190 | — | — | — | 8,644 | ||||||||||||||||||
| Collateralized mortgage obligations - agencies | — | — | — | — | 18,288 | 18,288 | ||||||||||||||||||
| Total amortized cost | $ | 26,526 | $ | 13,771 | $ | 1,379 | $ | 1,235 | $ | 28,464 | $ | 71,375 | ||||||||||||
| Fair value | $ | 26,701 | $ | 14,352 | $ | 1,488 | $ | 1,497 | $ | 29,072 | $ | 73,110 | ||||||||||||
The amortized cost and fair value of HTM investment securities as of March 31, 2020 were as follows:
| Maturing | ||||||||||||||||||||||||
| Due in One Year or Less |
After One Year But Within Five Years |
After Five Years But Within Ten Years |
After Ten Years | Securities with Variable Monthly Payments or Noncontractual Maturities |
Total | |||||||||||||||||||
| State and municipal | $ | 486 | $ | 1,155 | $ | 370 | $ | 80 | $ | — | $ | 2,091 | ||||||||||||
| Fair value | $ | 480 | $ | 1,122 | $ | 341 | $ | 72 | $ | — | $ | 2,015 | ||||||||||||
Throughout 2019, yields on bonds that met the Corporation's investment standards declined significantly. As such, the Corporation did not replace the majority of maturing investments in 2019. However, an influx of liquidity in late 2019 and into 2020 led the Corporation to make investment security purchases in order to stabilize net interest margin. Total investment securities are expected to grow with overall balance sheet growth as it is an important source of liquidity and consistent earnings. The following table summarizes information as of March 31, 2020 for investment securities purchased YTD:
| Book Value | Tax Effective Weighted Average Yield |
Weighted Average Remaining Maturity (Months) |
||||||||||||
| U.S. Government and federal agency | $ | 10,454 | 0.46 | % | 8 | |||||||||
| State and municipal | — | — | % | — | ||||||||||
| Collateralized mortgage obligations - agencies | 9,723 | 2.48 | % | 291 | ||||||||||
| Certificates of deposit | 1,984 | 1.01 | % | 5 | ||||||||||
| Mortgage backed residential | — | — | % | — | ||||||||||
| Held-to-maturity state and municipal | — | — | % | — | ||||||||||
| Total | $ | 22,161 | 1.40 | % | 132 | |||||||||
Loans held-for-sale
Loans held-for-sale represent the balance of loans that have been committed to be sold to the secondary market, but have not yet been delivered. The level of loans HFS fluctuates based on loan demand as well as the timing of loan deliveries to the secondary market. As residential mortgage activity is likely to decrease in 2020, the balance of loans HFS will also decline.
During the first quarter of 2020, the Corporation adopted SAB 109. Because of this adoption, the Corporation now recognizes loans HFS at fair value. The Corporation believes that fair value is the price at which the loans could be sold in the principal market at the measurement date.
Loans and allowance for loan losses
The following tables outline the composition and changes in the loan portfolio as of:
| 3/31/2020 | 12/31/2019 | 9/30/2019 | 6/30/2019 | 3/31/2019 | ||||||||||||||||
| Commercial | $ | 67,731 | $ | 71,689 | $ | 63,747 | $ | 63,998 | $ | 56,790 | ||||||||||
| Commercial real estate | 462,561 | 455,289 | 420,127 | 408,103 | 394,462 | |||||||||||||||
| Total commercial loans | 530,292 | 526,978 | 483,874 | 472,101 | 451,252 | |||||||||||||||
| Residential mortgage | 285,392 | 292,946 | 291,401 | 289,944 | 306,466 | |||||||||||||||
| Home equity | 43,222 | 41,987 | 43,061 | 42,890 | 43,130 | |||||||||||||||
| Total residential real estate loans | 328,614 | 334,933 | 334,462 | 332,834 | 349,596 | |||||||||||||||
| Consumer | 6,671 | 8,644 | 8,261 | 8,612 | 9,015 | |||||||||||||||
| Gross loans | 865,577 | 870,555 | 826,597 | 813,547 | 809,863 | |||||||||||||||
| Allowance for loan losses | (7,250 | ) | (5,813 | ) | (5,413 | ) | (5,014 | ) | (4,745 | ) | ||||||||||
| Loans, net | $ | 858,327 | $ | 864,742 | $ | 821,184 | $ | 808,533 | $ | 805,118 | ||||||||||
| 3/31/2020 vs 12/31/2019 | 3/31/2020 vs 3/31/2019 | |||||||||||||||||||
| Variance | Variance | |||||||||||||||||||
| Amount | % | Amount | % | |||||||||||||||||
| Commercial | $ | (3,958 | ) | (5.52 | )% | $ | 10,941 | 19.27 | % | |||||||||||
| Commercial real estate | 7,272 | 1.60 | % | 68,099 | 17.26 | % | ||||||||||||||
| Total commercial loans | 3,314 | 0.63 | % | 79,040 | 17.52 | % | ||||||||||||||
| Residential mortgage | (7,554 | ) | (2.58 | )% | (21,074 | ) | (6.88 | )% | ||||||||||||
| Home equity | 1,235 | 2.94 | % | 92 | 0.21 | % | ||||||||||||||
| Total residential real estate loans | (6,319 | ) | (1.89 | )% | (20,982 | ) | (6.00 | )% | ||||||||||||
| Consumer | (1,973 | ) | (22.83 | )% | (2,344 | ) | (26.00 | )% | ||||||||||||
| Gross loans | (4,978 | ) | (0.57 | )% | 55,714 | 6.88 | % | |||||||||||||
| Allowance for loan losses | (1,437 | ) | 24.72 | % | (2,505 | ) | 52.79 | % | ||||||||||||
| Loans, net | $ | (6,415 | ) | (0.74 | )% | $ | 53,209 | 6.61 | % | |||||||||||
The following table presents historical loan balances by portfolio segment and impairment evaluation as of:
| 3/31/2020 | 12/31/2019 | 9/30/2019 | 6/30/2019 | 3/31/2019 | ||||||||||||||||
| Originated loans collectively evaluated for impairment | ||||||||||||||||||||
| Commercial | $ | 66,524 | $ | 70,322 | $ | 61,970 | $ | 61,122 | $ | 53,549 | ||||||||||
| Commercial real estate | 446,713 | 436,626 | 400,470 | 386,970 | 372,347 | |||||||||||||||
| Residential mortgage | 280,265 | 286,635 | 285,499 | 283,638 | 299,439 | |||||||||||||||
| Home equity | 40,459 | 39,023 | 39,586 | 39,243 | 39,407 | |||||||||||||||
| Consumer | 6,391 | 8,330 | 7,902 | 8,169 | 8,404 | |||||||||||||||
| Subtotal | 840,352 | 840,936 | 795,427 | 779,142 | 773,146 | |||||||||||||||
| Originated loans individually evaluated for impairment | ||||||||||||||||||||
| Commercial | — | — | — | — | — | |||||||||||||||
| Commercial real estate | 1,658 | 1,668 | 1,677 | 1,703 | 2,058 | |||||||||||||||
| Residential mortgage | 672 | 1,362 | 631 | 660 | 618 | |||||||||||||||
| Home equity | — | — | 240 | 218 | — | |||||||||||||||
| Consumer | 5 | — | — | — | — | |||||||||||||||
| Subtotal | 2,335 | 3,030 | 2,548 | 2,581 | 2,676 | |||||||||||||||
| Acquired loans collectively evaluated for impairment | ||||||||||||||||||||
| Commercial | 1,204 | 1,362 | 1,753 | 2,806 | 3,160 | |||||||||||||||
| Commercial real estate | 13,630 | 16,346 | 17,194 | 18,526 | 19,164 | |||||||||||||||
| Residential mortgage | 3,459 | 3,911 | 4,139 | 4,388 | 5,070 | |||||||||||||||
| Home equity | 2,743 | 2,943 | 3,213 | 3,399 | 3,693 | |||||||||||||||
| Consumer | 273 | 314 | 358 | 441 | 608 | |||||||||||||||
| Subtotal | 21,309 | 24,876 | 26,657 | 29,560 | 31,695 | |||||||||||||||
| Acquired loans individually evaluated for impairment | ||||||||||||||||||||
| Commercial | — | — | — | — | — | |||||||||||||||
| Commercial real estate | — | — | — | — | — | |||||||||||||||
| Residential mortgage | 58 | 58 | 61 | 113 | 117 | |||||||||||||||
| Home equity | — | — | — | — | — | |||||||||||||||
| Consumer | — | — | — | — | — | |||||||||||||||
| Subtotal | 58 | 58 | 61 | 113 | 117 | |||||||||||||||
| Acquired loans with deteriorated credit quality | ||||||||||||||||||||
| Commercial | 3 | 5 | 24 | 70 | 81 | |||||||||||||||
| Commercial real estate | 560 | 649 | 786 | 904 | 893 | |||||||||||||||
| Residential mortgage | 938 | 980 | 1,071 | 1,145 | 1,222 | |||||||||||||||
| Home equity | 20 | 21 | 22 | 30 | 30 | |||||||||||||||
| Consumer | 2 | — | 1 | 2 | 3 | |||||||||||||||
| Subtotal | 1,523 | 1,655 | 1,904 | 2,151 | 2,229 | |||||||||||||||
| Gross Loans | $ | 865,519 | $ | 870,497 | $ | 826,536 | $ | 813,434 | $ | 809,746 | ||||||||||
| Total originated loans | $ | 842,687 | $ | 843,966 | $ | 797,975 | $ | 781,723 | $ | 775,822 | ||||||||||
| Total acquired loans | 22,890 | 26,589 | 28,622 | 31,824 | 34,041 | |||||||||||||||
| Gross loans | $ | 865,577 | $ | 870,555 | $ | 826,597 | $ | 813,547 | $ | 809,863 | ||||||||||
The following table presents historical allowance for loan losses allocations by portfolio segment and impairment evaluation as of:
| 3/31/2020 | 12/31/2019 | 9/30/2019 | 6/30/2019 | 3/31/2019 | ||||||||||||||||
| Originated loans collectively evaluated for impairment | ||||||||||||||||||||
| Commercial | $ | 478 | $ | 358 | $ | 301 | $ | 278 | $ | 240 | ||||||||||
| Commercial real estate | 3,609 | 2,790 | 2,539 | 2,381 | 2,282 | |||||||||||||||
| Residential mortgage | 2,442 | 1,917 | 1,820 | 1,662 | 1,744 | |||||||||||||||
| Home equity | 280 | 195 | 198 | 191 | 186 | |||||||||||||||
| Consumer | 89 | 87 | 87 | 90 | 88 | |||||||||||||||
| Subtotal | 6,898 | 5,347 | 4,945 | 4,602 | 4,540 | |||||||||||||||
| Originated loans individually evaluated for impairment | ||||||||||||||||||||
| Commercial | — | — | — | — | — | |||||||||||||||
| Commercial real estate | 111 | 127 | 26 | — | — | |||||||||||||||
| Residential mortgage | 6 | 128 | 27 | 28 | 39 | |||||||||||||||
| Home equity | — | — | 213 | 218 | — | |||||||||||||||
| Consumer | 5 | — | — | — | — | |||||||||||||||
| Subtotal | 122 | 255 | 266 | 246 | 39 | |||||||||||||||
| Acquired loans collectively evaluated for impairment | ||||||||||||||||||||
| Commercial | 1 | 1 | 2 | 5 | 3 | |||||||||||||||
| Commercial real estate | 7 | 5 | 5 | 5 | 8 | |||||||||||||||
| Residential mortgage | 9 | 8 | 9 | 9 | 12 | |||||||||||||||
| Home equity | 14 | 12 | 13 | 14 | 15 | |||||||||||||||
| Consumer | — | — | — | — | — | |||||||||||||||
| Subtotal | 31 | 26 | 29 | 33 | 38 | |||||||||||||||
| Acquired loans with deteriorated credit quality | ||||||||||||||||||||
| Commercial | — | — | — | — | — | |||||||||||||||
| Commercial real estate | 39 | 34 | 31 | 15 | 25 | |||||||||||||||
| Residential mortgage | 156 | 147 | 137 | 114 | 97 | |||||||||||||||
| Home equity | 4 | 4 | 5 | 4 | 4 | |||||||||||||||
| Consumer | — | — | — | — | 2 | |||||||||||||||
| Subtotal | 199 | 185 | 173 | 133 | 128 | |||||||||||||||
| Allowance for loan losses | $ | 7,250 | $ | 5,813 | $ | 5,413 | $ | 5,014 | $ | 4,745 | ||||||||||
| Total originated loans | $ | 7,020 | $ | 5,602 | $ | 5,211 | $ | 4,848 | $ | 4,579 | ||||||||||
| Total acquired loans | 230 | 211 | 202 | 166 | 166 | |||||||||||||||
| Allowance for loan losses | $ | 7,250 | $ | 5,813 | $ | 5,413 | $ | 5,014 | $ | 4,745 | ||||||||||
| Commercial | $ | 479 | $ | 359 | $ | 303 | $ | 283 | $ | 243 | ||||||||||
| Commercial real estate | 3,766 | 2,956 | 2,601 | 2,401 | 2,315 | |||||||||||||||
| Residential mortgage | 2,613 | 2,200 | 1,993 | 1,813 | 1,892 | |||||||||||||||
| Home equity | 298 | 211 | 429 | 427 | 205 | |||||||||||||||
| Consumer | 94 | 87 | 87 | 90 | 90 | |||||||||||||||
| Allowance for loan losses | $ | 7,250 | $ | 5,813 | $ | 5,413 | $ | 5,014 | $ | 4,745 | ||||||||||
The following table summarizes the Corporation's current, past due, and nonaccrual loans as of:
| 3/31/2020 | 12/31/2019 | 9/30/2019 | 6/30/2019 | 3/31/2019 | ||||||||||||||||
| Accruing interest | ||||||||||||||||||||
| Current | $ | 862,581 | $ | 867,901 | $ | 824,587 | $ | 811,184 | $ | 807,671 | ||||||||||
| Past due 30-89 days | 2,152 | 1,213 | 1,089 | 1,275 | 1,009 | |||||||||||||||
| Past due 90 days or more | 166 | 239 | 209 | 301 | 310 | |||||||||||||||
| Total accruing interest | 864,899 | 869,353 | 825,885 | 812,760 | 808,990 | |||||||||||||||
| Nonaccrual | 678 | 1,202 | 712 | 787 | 873 | |||||||||||||||
| Total loans | $ | 865,577 | $ | 870,555 | $ | 826,597 | $ | 813,547 | $ | 809,863 | ||||||||||
| Total loans past due and in nonaccrual status | $ | 2,996 | $ | 2,654 | $ | 2,010 | $ | 2,363 | $ | 2,192 | ||||||||||
The following table summarizes the Corporation's nonperforming assets as of:
| 3/31/2020 | 12/31/2019 | 9/30/2019 | 6/30/2019 | 3/31/2019 | ||||||||||||||||
| Nonaccrual loans | $ | 678 | $ | 1,202 | $ | 712 | $ | 787 | $ | 873 | ||||||||||
| Accruing loans past due 90 days or more | 166 | 239 | 209 | 301 | 310 | |||||||||||||||
| Total nonperforming loans | 844 | 1,441 | 921 | 1,088 | 1,183 | |||||||||||||||
| Other real estate owned | 400 | — | — | — | — | |||||||||||||||
| Total nonperforming assets | $ | 1,244 | $ | 1,441 | $ | 921 | $ | 1,088 | $ | 1,183 | ||||||||||
The following table summarizes the Corporation's primary asset quality measures as of:
| 3/31/2020 | 12/31/2019 | 9/30/2019 | 6/30/2019 | 3/31/2019 | |||||||||||
| Nonperforming loans to gross loans | 0.10 | % | 0.17 | % | 0.11 | % | 0.13 | % | 0.15 | % | |||||
| Nonperforming assets to total assets | 0.12 | % | 0.14 | % | 0.09 | % | 0.11 | % | 0.13 | % | |||||
| Allowance for loan losses to gross loans | 0.84 | % | 0.67 | % | 0.65 | % | 0.62 | % | 0.59 | % | |||||
The following table summarizes the balance of net unamortized discounts on purchased loans as of:
| 3/31/2020 | 12/31/2019 | 9/30/2019 | 6/30/2019 | 3/31/2019 | ||||||||||||||||
| Net unamortized discount on purchased loans | $ | 1,233 | $ | 1,462 | $ | 1,626 | $ | 1,914 | $ | 2,095 | ||||||||||
As outlined in the preceding tables, the Corporation has been successful in growing its loan portfolio over the past 12 months with most of the growth coming in the form of commercial and commercial real estate loans. Despite the significant growth, the Corporation has not relaxed its underwriting standards as evidenced by the low level of nonperforming loans.
While the Corporation's credit quality metrics remain at historically low levels, the uncertainty in the local, national and global economy, especially as it relates to the impact of the COVID-19 global pandemic, the Corporation increased the ALLL by $1,437, or 24.72%, as March 31, 2020.
The following table summarizes the average loan size as of:
| 3/31/2020 | 12/31/2019 | 9/30/2019 | 6/30/2019 | 3/31/2019 | ||||||||||||||||
| Commercial | $ | 214 | $ | 228 | $ | 204 | $ | 195 | $ | 174 | ||||||||||
| Commercial real estate | 644 | 641 | 605 | 609 | 597 | |||||||||||||||
| Total commercial loans | 513 | 514 | 481 | 473 | 457 | |||||||||||||||
| Residential mortgage | 194 | 198 | 200 | 206 | 206 | |||||||||||||||
| Home equity | 46 | 44 | 45 | 45 | 45 | |||||||||||||||
| Total residential real estate loans | 137 | 138 | 139 | 140 | 142 | |||||||||||||||
| Consumer | 26 | 32 | 31 | 32 | 33 | |||||||||||||||
| Gross loans | $ | 234 | $ | 234 | $ | 225 | $ | 223 | $ | 218 | ||||||||||
COVID-19, CARES Act and SBA activity
As stated above, the communities which the Corporation serves were not immune to the fallout of the COVID-19 global pandemic. The Corporation has committed significant efforts to work with customers through temporary loan modifications and participation in the PPP loan program.
The Corporation has been extremely active in participating in the PPP loan program. As of April 29, 2020 the Corporation had approved 1,128 loans totaling $208,607. To help fund PPP loans, the Federal Reserve established the PPPLF to supply liquidity in the form of non-recourse loans to participating financial institutions. The PPPLF will accept the PPP loans as collateral at face value. Extensions of credit under the PPPLF will be made at a rate of 0.35% and there are no fees associated with PPPLF. As a funding precaution, the Corporation has established the ability to utilize the PPPLF. Additionally, the Corporation requested, and was approved for, a $75,000 increase in credit availability at the FHLB.
The CARES Act also provides a variety of accommodations for loans that the Corporation services for FHLMC including:
- Providing mortgage forbearance for up to 12 months,
- Waiving assessments of penalties and late fees,
- Halting all foreclosure actions and evictions of borrowers until at least May 17, 2020,
- Offering loan modification options that lower payments or keep payments the same after the forbearance period.
The table below outlines the COVID-19 related loan modifications that have been requested to, but not yet issued by, the Corporation through April 29, 2020:
| Number of Requests |
Outstanding Balance |
||||||
| Commercial | 63 | $ | 18,210 | ||||
| Commercial real estate | 163 | 128,888 | |||||
| Total commercial loan modification requests | 226 | 147,098 | |||||
| Residential mortgage loans serviced for FHLMC | — | — | |||||
| Portfolio residential mortgage loans | 40 | 11,317 | |||||
| Home equity | 6 | 373 | |||||
| Total residential real estate loan modification requests | 46 | 11,690 | |||||
| Consumer | 2 | 10 | |||||
| Total outstanding modification requests | 274 | $ | 158,798 | ||||
The table below outlines the COVID-19 related loan modifications issued by the Corporation through April 29, 2020:
| Number of Modifications |
Outstanding Balance |
||||||
| Commercial | 60 | $ | 21,173 | ||||
| Commercial real estate | 142 | 111,101 | |||||
| Total commercial loan modifications | 202 | 132,274 | |||||
| Residential mortgage loans serviced for FHLMC | 113 | 24,044 | |||||
| Portfolio residential mortgage loans | 95 | 22,999 | |||||
| Home equity | 16 | 1,429 | |||||
| Total residential real estate loan modifications | 224 | 48,472 | |||||
| Consumer | 2 | 22 | |||||
| Total modifications | 428 | $ | 180,768 | ||||
The Corporation considers the modification type on a loan-by-loan basis. Most modifications for loans held within the Corporation's loan portfolio resulted in the deferment of principal and interest payments for 3 months.
All other assets
The following tables outline the composition and changes in other assets as of:
| 3/31/2020 | 12/31/2019 | 9/30/2019 | 6/30/2019 | 3/31/2019 | ||||||||||||||||
| Premises and equipment, net | $ | 15,533 | $ | 15,245 | $ | 15,443 | $ | 14,792 | $ | 14,838 | ||||||||||
| Mortgage servicing rights | 3,980 | 4,030 | 3,900 | 3,758 | 3,414 | |||||||||||||||
| Accrued interest receivable | 3,124 | 2,877 | 2,954 | 3,350 | 3,298 | |||||||||||||||
| Corporate owned life insurance | 10,380 | 10,316 | 10,248 | 10,181 | 10,070 | |||||||||||||||
| Federal Home Loan Bank stock | 3,150 | 3,150 | 3,150 | 3,150 | 3,150 | |||||||||||||||
| Goodwill | 3,219 | 3,219 | 3,219 | 3,219 | 3,219 | |||||||||||||||
| Core deposit intangibles | 812 | 902 | 1,015 | 1,128 | 1,241 | |||||||||||||||
| Other real estate owned | 400 | — | — | — | — | |||||||||||||||
| Derivative assets | 1,063 | 125 | 172 | — | — | |||||||||||||||
| Right-of-use assets | 432 | 475 | 105 | 119 | 132 | |||||||||||||||
| Other assets | 2,154 | 1,763 | 1,622 | 1,437 | 1,126 | |||||||||||||||
| All other assets | $ | 44,247 | $ | 42,102 | $ | 41,828 | $ | 41,134 | $ | 40,488 | ||||||||||
| 3/31/2020 vs 12/31/2019 | 3/31/2020 vs 3/31/2019 | |||||||||||||||||||
| Variance | Variance | |||||||||||||||||||
| Amount | % | Amount | % | |||||||||||||||||
| Premises and equipment, net | $ | 288 | 1.89 | % | $ | 695 | 4.68 | % | ||||||||||||
| Mortgage servicing rights | (50 | ) | (1.24 | )% | 566 | 16.58 | % | |||||||||||||
| Accrued interest receivable | 247 | 8.59 | % | (174 | ) | (5.28 | )% | |||||||||||||
| Corporate owned life insurance | 64 | 0.62 | % | 310 | 3.08 | % | ||||||||||||||
| Federal Home Loan Bank stock | — | — | % | — | — | % | ||||||||||||||
| Goodwill | — | — | % | — | — | % | ||||||||||||||
| Core deposit intangibles | (90 | ) | (9.98 | )% | (429 | ) | (34.57 | )% | ||||||||||||
| Other real estate owned | 400 | N/M | 400 | N/M | ||||||||||||||||
| Derivative assets | 938 | 750.40 | % | 1,063 | N/M | |||||||||||||||
| Right-of-use assets | (43 | ) | (9.05 | )% | 300 | 227.27 | % | |||||||||||||
| Other assets | 391 | 22.18 | % | 1,028 | 91.30 | % | ||||||||||||||
| All other assets | 2,145 | 5.09 | % | $ | 3,759 | 9.28 | % | |||||||||||||
MSR are servicing assets that are recognized from the sales of mortgage loans. A portion of the cost of originating the loan is allocated to the servicing right based on relative fair value. The increase in MSR for 2019 is due to the increased volume of residential mortgage loan sales. As noted early, in the first quarter of 2020, the Corporation recognized an impairment on the MSR of $219. The Corporation does not expect any additional impairments for 2020, and expects nominal growth in MSR in 2020 due to continued residential mortgage origination.
Derivative assets are used in the process of hedging the Corporation's mortgage banking activities. The derivative assets are recorded at fair value at the end of each quarter. The Corporation does not expect significant growth in derivative assets as residential real estate lending is expected to tighten in 2020.
Right-of-use assets were established pursuant to the adoption of ASU 2016-02, "Leases (Topic 842)", on January 1, 2019. Right-of-use assets are recognized at the lease commencement date based on the estimated present value of the lease payments over the lease term, for leases that are longer than 12 months. The large increase from September 30, 2019 was due to an additional lease being entered into by the Corporation.
Total deposits
The following tables outline the composition and changes in the deposit portfolio as of:
| 3/31/2020 | 12/31/2019 | 9/30/2019 | 6/30/2019 | 3/31/2019 | ||||||||||||||||
| Noninterest bearing demand | $ | 281,848 | $ | 260,503 | $ | 253,784 | $ | 248,795 | $ | 237,213 | ||||||||||
| Interest bearing | ||||||||||||||||||||
| Savings | 215,748 | 215,218 | 213,494 | 232,130 | 230,006 | |||||||||||||||
| Money market demand | 79,070 | 88,350 | 80,873 | 69,374 | 61,294 | |||||||||||||||
| NOW | 83,910 | 75,976 | 39,286 | 14,925 | 17,450 | |||||||||||||||
| Time deposits | 223,261 | 223,055 | 213,664 | 227,331 | 243,570 | |||||||||||||||
| Total deposits | $ | 883,837 | $ | 863,102 | $ | 801,101 | $ | 792,555 | $ | 789,533 | ||||||||||
| 3/31/2020 vs 12/31/2019 | 3/31/2020 vs 3/31/2019 | |||||||||||||||||||
| Variance | Variance | |||||||||||||||||||
| Amount | % | Amount | % | |||||||||||||||||
| Noninterest bearing demand | $ | 21,345 | 8.19 | % | $ | 44,635 | 18.82 | % | ||||||||||||
| Interest bearing | ||||||||||||||||||||
| Savings | 530 | 0.25 | % | (14,258 | ) | (6.20 | )% | |||||||||||||
| Money market demand | (9,280 | ) | (10.50 | )% | 17,776 | 29.00 | % | |||||||||||||
| NOW | 7,934 | 10.44 | % | 66,460 | 380.86 | % | ||||||||||||||
| Time deposits | 206 | 0.09 | % | (20,309 | ) | (8.34 | )% | |||||||||||||
| Total deposits | $ | 20,735 | 2.40 | % | $ | 94,304 | 11.94 | % | ||||||||||||
The Corporation has continued its focus of growing non-contractual deposits while supplementing funding with time deposits. The Corporation has been able to drive this meaningful increase through enhanced organic growth strategies. For 2020, the Corporation expects to monitor deposit growth and adjust interest rates so as to create minimal pressure on the net interest margin.
Schedule of time deposit maturities
The following table summarizes the contractual maturities of the time deposits as of March 31, 2020:
| Maturity Buckets | ||||||||||||||||||||
| 3 Months or Less |
3 to 6 Months |
6 to 9 Months |
9 to 12 Months |
Beyond 12 Months |
||||||||||||||||
| Balance | $ | 77,034 | $ | 44,767 | $ | 35,959 | $ | 28,916 | $ | 36,585 | ||||||||||
| Weighted average yield | 1.97 | % | 2.05 | % | 1.90 | % | 1.28 | % | 1.82 | % | ||||||||||
| Cumulative Maturities | ||||||||||||||||||||
| 3 Months or Less |
Up to 6 Months |
Up to 9 Months |
Up to 12 Months |
Total | ||||||||||||||||
| Balance | $ | 77,034 | $ | 121,801 | $ | 157,760 | $ | 186,676 | $ | 223,261 | ||||||||||
| Weighted average yield | 1.97 | % | 2.00 | % | 1.98 | % | 1.87 | % | 1.86 | % | ||||||||||
Total borrowed funds
The following tables outline the composition and changes in borrowed funds as of:
| 3/31/2020 | 12/31/2019 | 9/30/2019 | 6/30/2019 | 3/31/2019 | ||||||||||||||||
| Federal Home Loan Bank borrowings | $ | 57,500 | $ | 47,500 | $ | 55,000 | $ | 40,000 | $ | 40,000 | ||||||||||
| Subordinated debentures | 14,000 | 14,000 | 14,000 | 14,000 | 14,000 | |||||||||||||||
| Federal funds purchased | — | — | — | — | 5,000 | |||||||||||||||
| Total borrowed funds | $ | 71,500 | $ | 61,500 | $ | 69,000 | $ | 54,000 | $ | 59,000 | ||||||||||
| 3/31/2020 vs 12/31/2019 | 3/31/2020 vs 3/31/2019 | |||||||||||||||||||
| Variance | Variance | |||||||||||||||||||
| Amount | % | Amount | % | |||||||||||||||||
| Federal Home Loan Bank borrowings | $ | 10,000 | 21.05 | % | $ | 17,500 | 43.75 | % | ||||||||||||
| Subordinated debentures | — | — | % | — | — | % | ||||||||||||||
| Federal funds purchased | — | — | % | (5,000 | ) | (100.00 | )% | |||||||||||||
| Total borrowed funds | $ | 10,000 | 16.26 | % | $ | 12,500 | 21.19 | % | ||||||||||||
While the Corporation increased its reliance on borrowed funds in 2018 to fund its strong loan demand, borrowed funds gradually declined in the quarters prior to December 31, 2019 as the Corporation has been able to fund organic growth through increases in deposit accounts. Total borrowed funds increased in the third quarter of 2019 as the interest rates for Federal Home Loan Bank borrowings were extremely attractive. Total borrowed funds are expected to decrease as current Federal Home Loan Bank borrowings mature. Although, as noted earlier, significant volume of PPP loans may cause the Corporation to utilize the PPPLF or other funding sources. The Corporation continually analyzes the market for opportunities and will borrow funds when deemed financially beneficial.
Wholesale funding sources
The following tables outline the composition and changes in wholesale funding sources as of:
| 3/31/2020 | 12/31/2019 | 9/30/2019 | 6/30/2019 | 3/31/2019 | ||||||||||||||||
| Federal Home Loan Bank borrowings | $ | 57,500 | $ | 47,500 | $ | 55,000 | $ | 40,000 | $ | 40,000 | ||||||||||
| Brokered time deposits | 28,605 | 28,605 | 16,326 | 23,484 | 35,398 | |||||||||||||||
| Internet time deposits | 18,005 | 18,009 | 21,977 | 25,058 | 26,452 | |||||||||||||||
| Total wholesale funds | $ | 104,110 | $ | 94,114 | $ | 93,303 | $ | 88,542 | $ | 101,850 | ||||||||||
| 3/31/2020 vs 12/31/2019 | 3/31/2020 vs 3/31/2019 | |||||||||||||||||||
| Variance | Variance | |||||||||||||||||||
| Amount | % | Amount | % | |||||||||||||||||
| Federal Home Loan Bank borrowings | $ | 10,000 | 21.05 | % | $ | 17,500 | 43.75 | % | ||||||||||||
| Brokered time deposits | — | — | % | (6,793 | ) | (19.19 | )% | |||||||||||||
| Internet time deposits | (4 | ) | (0.02 | )% | (8,447 | ) | (31.93 | )% | ||||||||||||
| Total wholesale funds | $ | 9,996 | 10.62 | % | $ | 2,260 | 2.22 | % | ||||||||||||
The Corporation utilizes wholesale funds to fund balance sheet growth. As wholesale funding is typically more expensive than core deposits, the Corporation continually analyzes sources of wholesale funding when the increases in interest earning assets out-pace the increases in core deposits.
Accrued interest payable and other liabilities
Accrued interest payable and other liabilities includes accrued interest payable, federal income taxes payable, deferred federal income taxes payable, and all other liabilities (none of which are individually significant). Accrued interest payable and other liabilities are not expected to fluctuate significantly in future periods.
Total shareholders' equity
Total shareholders' equity includes common stock, retained earnings, and AOCI. Total shareholders' equity is expected to continue to grow in 2020 through the Corporation's earnings. In April 2020, the Corporation's Board of Directors amended its common stock repurchase plan to authorize the repurchase of up to $5,000 of common stock.
Stock Performance
The following graph compares the cumulative total shareholder return on the Corporation's common stock for the last five years with the cumulative total return on the ABA NASDAQ Community Bank Index (NASDAQ: XX:ABAQ) over the same period. The graph assumes the value of an investment in the Corporation's common stock and the ABA NASDAQ Community Bank Index was $100 at March 31, 2015 and all dividends were reinvested.
A graph accompanying this announcement is available at https://www.globenewswire.com/NewsRoom/AttachmentNg/d16a1278-56d1-47e4-9926-0694caf011c3
| Date | FETM | ABQ Index | ||||||
| 3/31/2015 | $ | 100.00 | $ | 100.00 | ||||
| 3/31/2016 | 126.00 | 101.56 | ||||||
| 3/31/2017 | 154.75 | 140.48 | ||||||
| 3/31/2018 | 171.08 | 148.82 | ||||||
| 3/31/2019 | 182.67 | 130.86 | ||||||
| 3/31/2020 | 140.17 | 93.22 | ||||||
Abbreviations and Acronyms
| ABA: American Bankers Association | IRA: Individual retirement account |
| ALLL: Allowance for loan losses | ITM: Interactive teller machine |
| AOCI: Accumulated other comprehensive income | MSR: Mortgage servicing rights |
| ASU: Accounting Standards Update | N/M: Not meaningful |
| ATM: Automated teller machine | NASDAQ: National Association of Securities Dealers Automated Quotations |
| CARES Act: Coronavirus Aid, Relief, and Economic Security Act | NOW: Negotiable order of withdrawal |
| CET1: Common equity tier 1 | NSF: Non-sufficient funds |
| COVID-19: Coronavirus Disease 2019 | OREO: Other real estate owned |
| FDIC: Federal Deposit Insurance Corporation | PPP: Paycheck Protection Program |
| FHLB: Federal Home Loan Bank | PPPLF: Paycheck Protection Program Liquidity Facility |
| FHLMC: Federal Home Loan Mortgage Corporation | QTD: Quarter-to-date |
| FRB: Federal Reserve Bank | SAB: Staff Accounting Bulletin |
| FTE: Fully taxable equivalent | SBA: Small Business Association |
| GAAP: Generally Accepted Accounting Principles | YTD: Year-to-date |
| HFS: Held-for-sale | USDA: United States Department of Agriculture |
| HTM: Held-to-maturity | |
About Fentura Financial, Inc. and The State Bank
Fentura Financial, Inc. is the holding company for The State Bank. It was formed in 1987 and is traded on the OTCQX exchange under the symbol FETM, and was recognized as one of the Top 50 performing stocks in 2016 and 2018 on that exchange.
The State Bank is a full-service, 5-Star Bauer Financial rated commercial, retail and trust bank headquartered in Fenton, Michigan. It currently operates 15 full-service branches in Genesee, Livingston, Oakland, Saginaw, and Shiawassee Counties and a loan production office in Saginaw County. The State Bank was ranked #20 by S&P Global in terms of 2018 performance for banks under $2 billion in assets. The State Bank’s commercial department provides a complete array of products including lines of credit, term loans, commercial mortgages, SBA loans and a full-suite of cash management products. The retail department offers personal checking, savings, time and IRA deposit accounts and a wide array of loan products including home equity, auto and personal loans. The residential loan department offers construction, purchase and refinance residential mortgage loans. The wealth management department offers a full-service suite of trust and portfolio management services. More information can be found at www.thestatebank.com or www.fentura.com.
Cautionary Statement: This press release contains certain forward-looking statements that involve risks and uncertainties. Forward-looking statements include, but are not limited to, statements concerning future growth in earning assets and net income. Such statements are subject to certain risks and uncertainties which could cause actual results to differ materially from those expressed or implied by such forward-looking statements, including, but not limited to, economic, competitive, governmental and technological factors affecting the Company's operations, markets, products, services, interest rates and fees for services. Readers are cautioned not to place undue reliance on these forward-looking statements, which speak only as of the date of this press release.
| Contacts: | Ronald L. Justice | Aaron D. Wirsing |
| President & CEO | Chief Financial Officer | |
| Fentura Financial, Inc. | Fentura Financial, Inc. | |
| 810.714.3902 | 810.714.3925 | |
| ronj@thestatebank.com | aaronw@thestatebank.com |
![]()
Stock Performance Five-Year Total Return
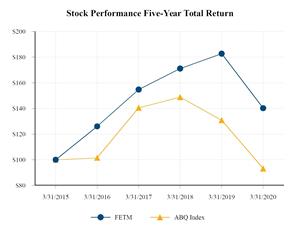
Stock Performance Five-Year Total Return
Legal Disclaimer:
EIN Presswire provides this news content "as is" without warranty of any kind. We do not accept any responsibility or liability for the accuracy, content, images, videos, licenses, completeness, legality, or reliability of the information contained in this article. If you have any complaints or copyright issues related to this article, kindly contact the author above.
