

Mackinac Financial Corporation Reports 2018 Fourth Quarter and Annual Results
MANISTIQUE, Mich., Jan. 31, 2019 (GLOBE NEWSWIRE) -- Mackinac Financial Corporation (Nasdaq: MFNC) (the “Corporation”), the bank holding company for mBank, today announced 2018 net income of $8.37 million, or $.94 per share, compared to 2017 net income of $5.48 million, or $.87 per share.
|
|||||||||||||||||||||||||
The 2018 results included expenses related to the acquisitions of First Federal of Northern Michigan (“FFNM”), and Lincoln Community Bank (“Lincoln”), which had a collective after-tax impact of $2.46 million on earnings. The 2017 results include the effects of a $2.02 million non-cash tax expense related to the revaluation of the company’s Deferred Tax Asset (“DTA”) as a result of the corporate tax code change in December 2017 and a small amount of transaction expenses related to FFNM. Adjusted core income (net of transaction related expenses) for 2018 was $10.83 million or $1.22 per share compared to 2017 adjusted core income (net of the DTA expense) of $7.54 million, or $1.20 per share.
Weighted average shares outstanding for 2018 were 8,891,967 compared to 6,288,791 for 2017. Weighted average shares outstanding for the fourth quarter 2018 were 10,712,745 compared to 6,294,930 for the same period of 2017. The Corporation issued 2,146,378 new shares for the FFNM purchase in May 2018 and issued an additional 2,225,807 shares related to the common stock offering completed in June 2018.
The Corporation had fourth quarter 2018 net income of $3.36 million or $.31 per share compared to a $20 thousand loss ($0.00 per share) for the same period of 2017 due to the impact of the DTA revaluation. The 2018 fourth quarter results were impacted by acquisition related expenses of $386 thousand on an after-tax basis. 2018 fourth quarter income, excluding tax-affected transaction related expenses, was $3.75 million or $.35 per share compared to 2017 income, net of the DTA expense, of $2.07 million or $0.33 per share.
Total assets of the Corporation at December 31, 2018 were $1.32 billion, compared to $985.37 million at December 31, 2017. Shareholders’ equity at December 31, 2018 totaled $152.07 million, compared to $81.40 million at December 31, 2017. Book value per share outstanding equated to $14.20 at year-end 2018 compared to $12.93 per share outstanding a year ago. Tangible book value at year-end 2018 was $124.33 million or $11.61 per share outstanding compared to $73.78 million or $11.72 per share at year-end 2017.
Additional notes:
- mBank, the Corporation’s primary asset, recorded net income of $9.04 million in 2018, compared to $8.98 million in 2017. In December 2018, mBank had an internal tax allocation expense between it and the Corporation (MFNC) of $1.34 million. This adjustment resulted from the internal DTA allocation from 2017 and did not have an impact on the consolidated MFNC reported income or balance sheet for 2018. It was, however, reflected in the mBank 2018 year-end Call Report. Adjusted core net income for 2018 (including total adjustments for the tax reallocation and transaction related expenses of $3.16 million on an after-tax basis) was $12.20 million compared to 2017 core net income of the aforementioned $8.98 million. Adjusted bank core net income grew approximately 36%.
- As expected, FFNM and Lincoln have been fully integrated into the Corporation and mBank as of year-end 2018. No further significant transaction related expenses are expected from these acquisitions in 2019 and beyond.
- Adjusted income before taxes of the Corporation (net of pre-tax transaction related expenses) was $13.71 million in 2018 compared to $11.12 million in 2017, which eliminates the effect of the non-cash DTA expense year-over-year. Adjusted fourth quarter income before taxes was $4.75 million in 2018 compared to $2.94 million in 2017, an increase of 61%.
- Reliance on higher cost brokered deposits decreased significantly from $175.30 million or 21.43% of total deposits at year-end 2017 to $136.76 million or 12.46% of total deposits at year-end 2018.
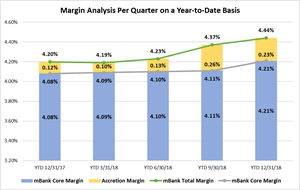
- 2018 net interest margin (NIM) remains strong at 4.44%. Core operating margin, which is net of accretion from acquired loans that were subject to purchase accounting adjustments, was 4.21%.
Revenue
Total revenue of the Corporation for 2018 was $59.64 million compared to $48.42 million in 2017. Total revenue for the three months ended December 31, 2018 equated to $17.54 million compared to $12.71 million for the same period of 2017. Total interest income for 2018 was $55.38 million compared to $44.38 million for the same period in 2017. Fourth quarter interest income equated to $16.09 million compared to $11.39 million in the fourth quarter of 2017. The 2018 fourth quarter interest income included accretive yield of $946 thousand from combined credit mark accretion associated with acquisitions compared to $503 thousand in the same period of 2017.
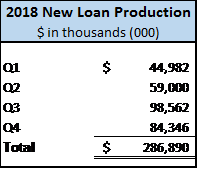
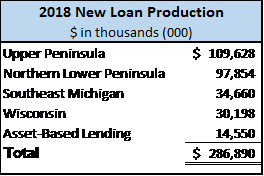
Loan Production
Total balance sheet loans at December 31, 2018 were $1.04 billion compared to December 31, 2017 balances of $811.08 million. Total loans under management now reside at $1.38 billion, which includes $338.17 million of service retained loans. New loan production for 2018 was $287 million, with origination activity increasing through the second half of the year, as expected. Commercial originations accounted for $169 million, retail (predominantly mortgage), equated to $46 million, secondary market mortgage production was $57 million and Asset Based Lending (ABL) $15 million. The tables below illustrate year-to-date new loan production totals by region as well as bank-wide new loan production by quarter for 2018 highlighting the effect of seasonality on operations due to the Corporation’s geographic footprint.
Images accompanying this section are available:
http://www.globenewswire.com/NewsRoom/AttachmentNg/d9baaebc-7e14-4ea6-88af-81e01f98526c
http://www.globenewswire.com/NewsRoom/AttachmentNg/746784e5-89b3-409b-b9dd-31ae5adb825e
Commenting on new loan production and overall lending activities, President of the Corporation and President and CEO of mBank, Kelly W. George, stated, “Commercial loan production outpaced last year’s totals by $27 million with a continued competitive environment for high-quality credits. We believe the acquired FFNM markets and Wisconsin markets will continue to have a positive impact on all types of originations and we are very pleased with their contributions since the acquisitions and their full integration into our lending culture. Secondary market activity has improved in the third and fourth quarters but remained $9 million less than 2017 after a slower start to the year, predominately driven by the expected slowdown in refinance activity. Commercial payoff activity was somewhat elevated this year, totaling $56 million as we saw continued fixed-rate pricing pressure and terms that led us to pass on renewing some larger client relationships that we felt were not prudent to retain for the long-term stability of our margin and macro portfolio mix. We also saw several clients divest of various types of large real estate development projects for liquidity and redeployment of their capital throughout the latter part of the year. Overall, we remain pleased with our lending activities in 2018 and the outlook for 2019 absent any significant adverse market conditions. Key lending personnel should also be able to focus greater time on organic growth initiatives given the multiple acquisition and capital raise activities throughout 2018.”
Credit Quality
Nonperforming loans totaled $5.08 million, or .49% of total loans at December 31, 2018 compared to $2.57 million, or .32% of total loans at December 31, 2017. The increase in non-performing loans is mainly the result of credits acquired in the FFNM transaction, which were marked to fair value as part of the credit due diligence process. Total loan delinquencies greater than 30 days resided at a nominal .96%, compared to .66% in 2017. Provision for loan loss expense for the fourth quarter 2018 was $300 thousand.
Commenting on overall credit risk, Mr. George stated, “As expected, we saw a slight increase in our non-performing and problem loan credit ratios following the FFNM and Lincoln acquisitions. We have seen no signs of any adverse systemic issues in terms of increased payment period times for legacy clients or material deterioration in commercial client financial statements in any of our core industries in which we lend. Similar to previous transactions, we anticipate this slight increase to nonperforming loans and delinquencies will normalize over the coming quarters as we continue to work quickly in resolving these acquired problem credits, either through exit from the bank, or when possible, rehabilitation to an acceptable loan structure and performance. Also, purchase accounting marks from the previously acquired banks have continued to prove accurate, attaining expected accretion levels.”
Margin Analysis and Funding
Net interest income for 2018 was $47.13 million, leading to a Net Interest Margin (NIM) of 4.44% compared to $37.94 million in 2017 and a NIM of 4.20%. Core operating margin, which is net of accretion from acquired loans that were subject to purchase accounting adjustments, was 4.21% for 2018. Net interest income for the fourth quarter of 2018 resided at $13.79 million, and a NIM of 4.64%, compared to $9.66 million and a NIM of 4.18% in the fourth quarter of 2017. 2018 total interest expense was $8.25 million versus $6.44 million for 2017 due mainly to a larger deposit base following the FFNM transaction and partially to an increase in rates on brokered deposits.
An image accompanying this section is available:
http://www.globenewswire.com/NewsRoom/AttachmentNg/2e338882-3736-4892-9601-ce9aea17ba9d
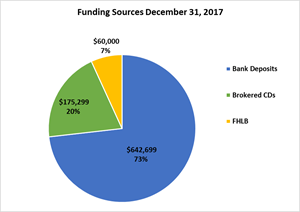
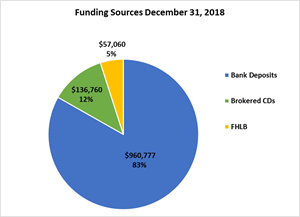
Total bank deposits (excluding brokered deposits) have increased by $318.08 million year-over-year from $642.70 million in 2017 to $960.78 million at year-end 2018. Total brokered deposits were $136.76 million at the end of December 2018, down from $175.30 million at December 31, 2017. FHLB and other borrowings were also down slightly from $60 million at year-end 2017 to $57 million at the end of 2018.
Images accompanying this section are available:
http://www.globenewswire.com/NewsRoom/AttachmentNg/35e0e7ff-1f86-4a71-8c66-499610696bf5
http://www.globenewswire.com/NewsRoom/AttachmentNg/a24cda39-9db6-4194-aedc-0a46f7001d40
Mr. George stated, “With the lower cost core deposit base we acquired from FFNM and Lincoln, we were able to reposition the balance sheet and remove approximately $40 million of much higher cost wholesale funding sources in 2018. We also continue to maintain our pricing discipline with regard to fixed rate lending, primarily on the commercial side to ensure margin sustainability. The impact of any future Federal Reserve Bank rate moves on funding sources are expected to be more than offset by the positive impact from the increase in the variable rate portion of our well-balanced loan portfolio given the structure of our balance sheet. We have not seen any significant pricing pressure in our high value deposit markets and have had to make nominal increases in our deposit products to remain rate-competitive and offset any potential outflows. Our focus on new core deposit procurement remains a key initiative for 2019 as we look to continue to wind down our wholesale funding sources through aggressive marketing and business development initiatives within our retail branch and treasury management business lines in target markets where greater opportunities exist.”
Noninterest Income / Expense
2018 Noninterest Income was $4.26 million compared to $4.04 million for 2017. While year-over-year improvement is negligible, 2017 included approximately $230 thousand in additional gains on sales of securities from the bank investment portfolio as well as $315 thousand more in gains on sale of secondary market mortgages and Small Business Administration (SBA) loans compared to 2018. Overall, non-interest income generated from the larger bank platform is trending positively and we expect SBA income to normalize in 2019. Noninterest Expense for 2018 was $40.30 million compared to $30.36 million in 2017. The expense variance from 2017 was heavily impacted by the additional expense related to the larger bank platform following the FFNM and Lincoln transactions including additional salary, benefits and occupancy costs as well as the transaction related expenses.
Assets and Capital
Total assets of the Corporation at December 31, 2018 were $1.32 billion, compared to $985.37 million at December 31, 2017. Shareholders’ equity at December 31, 2018 totaled $152.07 million, compared to $81.40 million at December 31, 2017. Both the common stock offering and the FFNM acquisition had positive impacts on the Corporation’s overall capitalization and regulatory capital ratios. Of the $32.4 million in net proceeds from the June 2018 common stock offering, the Corporation utilized $19.45 million to retire senior holding company debt and $8.5 million for the purchase of Lincoln. Both the Corporation and the Bank are “well-capitalized” with total risk-based capital to risk-weighted assets of 12.47% and 12.22% and tier 1 capital to total tier 1 average assets at the corporation of 9.24% and at the bank of 9.02%.
Paul D. Tobias, Chairman and Chief Executive Officer of the Corporation and Chairman of mBank concluded, “We believe that 2018 was an extremely productive and transformative year. We continue to execute our growth and acquisition strategy while maintaining focus on credit quality, scale efficiencies, community support and governance. Our balance sheet attributes are strong due to a capital raise that provides us with a cushion that will help us maintain our ability to seek well-priced acquisitions. The complementary core deposit base of FFNM and Lincoln allowed us to restructure our liabilities, reducing holding company debt and wholesale funding levels at an opportune time in the rate cycle. Our patience and discipline have served us well in all aspects of our business. We remain optimistic that we will develop acquisition opportunities as we grow organically. Our focus on efficiency and improved profitability always will be paramount.”
Mackinac Financial Corporation is a registered bank holding company formed under the Bank Holding Company Act of 1956 with assets in excess of $1.3 billion and whose common stock is traded on the NASDAQ stock market as “MFNC.” The principal subsidiary of the Corporation is mBank. Headquartered in Manistique, Michigan, mBank has 29 branch locations; eleven in the Upper Peninsula, ten in the Northern Lower Peninsula, one in Oakland County, Michigan, and seven in Northern Wisconsin. The Company’s banking services include commercial lending and treasury management products and services geared toward small to mid-sized businesses, as well as a full array of personal and business deposit products and consumer loans.
Forward-Looking Statements
This release contains certain forward-looking statements. Words such as “anticipates,” “believes,” “estimates,” “expects,” “intends,” “should,” “will,” and variations of such words and similar expressions are intended to identify forward-looking statements: as defined by the Private Securities Litigation Reform Act of 1995. These statements reflect management’s current beliefs as to expected outcomes of future events and are not guarantees of future performance. These statements involve certain risks, uncertainties and assumptions that are difficult to predict with regard to timing, extent, likelihood, and degree of occurrence. Therefore, actual results and outcomes may materially differ from what may be expressed or forecasted in such forward-looking statements. Factors that could cause a difference include among others: changes in the national and local economies or market conditions; changes in interest rates and banking regulations; the impact of competition from traditional or new sources; and the possibility that anticipated cost savings and revenue enhancements from mergers and acquisitions, bank consolidations, and other sources may not be fully realized at all or within specified time frames as well as other risks and uncertainties including but not limited to those detailed from time to time in filings of the Company with the Securities and Exchange Commission. These and other factors may cause decisions and actual results to differ materially from current expectations. Mackinac Financial Corporation undertakes no obligation to revise, update, or clarify forward-looking statements to reflect events or conditions after the date of this release.
MACKINAC FINANCIAL CORPORATION AND SUBSIDIARIES
SELECTED FINANCIAL HIGHLIGHTS
| As of and For the | As of and For the | ||||||||||
| Year Ending | Year Ending | ||||||||||
| December 31, | December 31, | ||||||||||
| (Dollars in thousands, except per share data) | 2018 | 2017 | |||||||||
| (Unaudited) | |||||||||||
| Selected Financial Condition Data (at end of period): | |||||||||||
| Assets | $ | 1,318,040 | $ | 985,367 | |||||||
| Loans | 1,038,864 | 811,078 | |||||||||
| Investment securities | 116,748 | 75,897 | |||||||||
| Deposits | 1,097,537 | 817,998 | |||||||||
| Borrowings | 60,441 | 79,552 | |||||||||
| Shareholders' equity | 152,069 | 81,400 | |||||||||
| Selected Statements of Income Data: | |||||||||||
| Net interest income | $ | 47,130 | $ | 37,938 | |||||||
| Income before taxes | 10,593 | 11,018 | |||||||||
| Net income | 8,367 | 5,479 | |||||||||
| Income per common share - Basic | .94 | .87 | |||||||||
| Income per common share - Diluted | .94 | .87 | |||||||||
| Weighted average shares outstanding | 8,891,967 | 6,288,791 | |||||||||
| Weighted average shares outstanding- Diluted | 8,921,658 | 6,322,413 | |||||||||
| Selected Financial Ratios and Other Data: | |||||||||||
| Performance Ratios: | |||||||||||
| Net interest margin | 4.44 | % | 4.20 | % | |||||||
| Efficiency ratio | 77.70 | 71.39 | |||||||||
| Return on average assets | .71 | .55 | |||||||||
| Return on average equity | 6.94 | 6.74 | |||||||||
| Average total assets | $ | 1,177,455 | $ | 995,826 | |||||||
| Average total shareholders' equity | 120,478 | 81,349 | |||||||||
| Average loans to average deposits ratio | 97.75 | % | 96.29 | % | |||||||
| Common Share Data at end of period: | |||||||||||
| Market price per common share | $ | 13.65 | $ | 15.90 | |||||||
| Book value per common share | 14.20 | 12.93 | |||||||||
| Tangible book value per share | 11.61 | 11.72 | |||||||||
| Dividends paid per share, annualized | .480 | .480 | |||||||||
| Common shares outstanding | 10,712,745 | 6,294,930 | |||||||||
| Other Data at end of period: | |||||||||||
| Allowance for loan losses | $ | 5,183 | $ | 5,079 | |||||||
| Non-performing assets | $ | 8,196 | $ | 6,126 | |||||||
| Allowance for loan losses to total loans | .50 | % | .63 | % | |||||||
| Non-performing assets to total assets | .62 | % | .62 | % | |||||||
| Texas ratio | 6.33 | % | 7.77 | % | |||||||
| Number of: | |||||||||||
| Branch locations | 29 | 23 | |||||||||
| FTE Employees | 288 | 233 | |||||||||
MACKINAC FINANCIAL CORPORATION AND SUBSIDIARIES
CONSOLIDATED BALANCE SHEETS
| December 31, | December 31, | |||||||
| 2018 | 2017 | |||||||
| (Unaudited) | ||||||||
| ASSETS | ||||||||
| Cash and due from banks | $ | 64,151 | $ | 37,420 | ||||
| Federal funds sold | 6 | 6 | ||||||
| Cash and cash equivalents | 64,157 | 37,426 | ||||||
| Interest-bearing deposits in other financial institutions | 13,452 | 13,374 | ||||||
| Securities available for sale | 116,248 | 75,397 | ||||||
| Other securities | 500 | 500 | ||||||
| Federal Home Loan Bank stock | 4,924 | 3,112 | ||||||
| Loans: | ||||||||
| Commercial | 717,032 | 572,936 | ||||||
| Mortgage | 301,461 | 220,708 | ||||||
| Consumer | 20,371 | 17,434 | ||||||
| Total Loans | 1,038,864 | 811,078 | ||||||
| Allowance for loan losses | (5,183 | ) | (5,079 | ) | ||||
| Net loans | 1,033,681 | 805,999 | ||||||
| Premises and equipment | 22,783 | 16,290 | ||||||
| Other real estate held for sale | 3,119 | 3,558 | ||||||
| Deferred tax asset | 5,763 | 4,970 | ||||||
| Deposit based intangibles | 5,720 | 1,922 | ||||||
| Goodwill | 22,024 | 5,694 | ||||||
| Other assets | 25,669 | 17,125 | ||||||
| TOTAL ASSETS | $ | 1,318,040 | $ | 985,367 | ||||
| LIABILITIES AND SHAREHOLDERS' EQUITY | ||||||||
| LIABILITIES: | ||||||||
| Deposits: | ||||||||
| Noninterest bearing deposits | $ | 241,556 | $ | 148,079 | ||||
| NOW, money market, interest checking | 368,890 | 280,309 | ||||||
| Savings | 111,358 | 61,097 | ||||||
| CDs<$250,000 | 225,236 | 142,159 | ||||||
| CDs>$250,000 | 13,737 | 11,055 | ||||||
| Brokered | 136,760 | 175,299 | ||||||
| Total deposits | 1,097,537 | 817,998 | ||||||
| Federal funds purchased | 2,905 | - | ||||||
| Borrowings | 57,536 | 79,552 | ||||||
| Other liabilities | 7,993 | 6,417 | ||||||
| Total liabilities | 1,165,971 | 903,967 | ||||||
| SHAREHOLDERS' EQUITY: | ||||||||
| Common stock and additional paid in capital - No par value | ||||||||
| Authorized - 18,000,000 shares | ||||||||
| Issued and outstanding - 10,712,745 and 6,294,930, shares respectively | 129,066 | 61,981 | ||||||
| Retained earnings | 23,466 | 19,711 | ||||||
| Accumulated other comprehensive income | ||||||||
| Unrealized gains (losses) on available for sale securities | (245 | ) | (71 | ) | ||||
| Minimum pension liability | (218 | ) | (221 | ) | ||||
| Total shareholders' equity | 152,069 | 81,400 | ||||||
| TOTAL LIABILITIES AND SHAREHOLDERS' EQUITY | $ | 1,318,040 | $ | 985,367 | ||||
MACKINAC FINANCIAL CORPORATION AND SUBSIDIARIES
CONSOLIDATED STATEMENTS OF OPERATIONS
| For the Years Ended | |||||||||||
| December 31, | |||||||||||
| 2018 | 2017 | 2016 | |||||||||
|
(Unaudited) |
(Audited) | (Audited) | |||||||||
| INTEREST INCOME: | |||||||||||
| Interest and fees on loans: | |||||||||||
| Taxable | $ | 51,407 | $ | 41,770 | $ | 36,078 | |||||
| Tax-exempt | 123 | 95 | 64 | ||||||||
| Interest on securities: | |||||||||||
| Taxable | 2,408 | 1,606 | 1,322 | ||||||||
| Tax-exempt | 338 | 298 | 220 | ||||||||
| Other interest income | 1,101 | 607 | 299 | ||||||||
| Total interest income | 55,377 | 44,376 | 37,983 | ||||||||
| INTEREST EXPENSE: | |||||||||||
| Deposits | 6,492 | 4,361 | 3,322 | ||||||||
| Borrowings | 1,755 | 2,077 | 1,563 | ||||||||
| Total interest expense | 8,247 | 6,438 | 4,885 | ||||||||
| Net interest income | 47,130 | 37,938 | 33,098 | ||||||||
| Provision for loan losses | 500 | 625 | 600 | ||||||||
| Net interest income after provision for loan losses | 46,630 | 37,313 | 32,498 | ||||||||
| OTHER INCOME: | |||||||||||
| Deposit service fees | 1,441 | 1,056 | 995 | ||||||||
| Income from mortgage loans sold on the secondary market | 1,289 | 1,373 | 1,575 | ||||||||
| SBA/USDA loan sale gains | 661 | 867 | 897 | ||||||||
| Mortgage servicing income - net | 197 | (31 | ) | (40 | ) | ||||||
| Net security gains | - | 231 | 150 | ||||||||
| Other | 675 | 545 | 576 | ||||||||
| Total other income | 4,263 | 4,041 | 4,153 | ||||||||
| OTHER EXPENSE: | |||||||||||
| Salaries and employee benefits | 20,064 | 15,490 | 14,625 | ||||||||
| Occupancy | 3,640 | 3,104 | 2,680 | ||||||||
| Furniture and equipment | 2,548 | 2,209 | 1,749 | ||||||||
| Data processing | 2,503 | 2,037 | 1,620 | ||||||||
| Advertising | 905 | 711 | 620 | ||||||||
| Professional service fees | 1,575 | 1,534 | 1,169 | ||||||||
| Loan and deposit | 1,166 | 1,335 | 1,100 | ||||||||
| Writedowns and losses on other real estate held for sale | 182 | 388 | 202 | ||||||||
| FDIC insurance assessment | 700 | 731 | 488 | ||||||||
| Telephone | 726 | 604 | 528 | ||||||||
| Transaction related expenses | 2,951 | 50 | 3,101 | ||||||||
| Other | 3,340 | 2,143 | 2,003 | ||||||||
| Total other expenses | 40,300 | 30,336 | 29,885 | ||||||||
| Income before provision for income taxes | 10,593 | 11,018 | 6,766 | ||||||||
| Provision for (benefit of) income taxes | 2,226 | 5,539 | 2,283 | ||||||||
| NET INCOME AVAILABLE TO COMMON SHAREHOLDERS | $ | 8,367 | $ | 5,479 | $ | 4,483 | |||||
| INCOME PER COMMON SHARE: | |||||||||||
| Basic | $ | .94 | $ | .87 | $ | .72 | |||||
| Diluted | $ | .94 | $ | .87 | $ | .71 | |||||
MACKINAC FINANCIAL CORPORATION AND SUBSIDIARIES
LOAN PORTFOLIO AND CREDIT QUALITY
(Dollars in thousands)
Loan Portfolio Balances (at end of period):
| December 31, | December 31, | |||||
| 2018 | 2017 | |||||
| (Unaudited) | (Unaudited) | |||||
| Commercial Loans: | ||||||
| Real estate - operators of nonresidential buildings | $ | 150,251 | $ | 119,025 | ||
| Hospitality and tourism | 77,598 | 75,228 | ||||
| Lessors of residential buildings | 50,204 | 33,032 | ||||
| Gasoline stations and convenience stores | 24,189 | 21,176 | ||||
| Logging | 20,860 | 17,554 | ||||
| Commercial construction | 12,752 | 9,243 | ||||
| Other | 381,178 | 297,678 | ||||
| Total Commercial Loans | 717,032 | 572,936 | ||||
| 1-4 family residential real estate | 286,908 | 209,890 | ||||
| Consumer | 20,371 | 17,434 | ||||
| Consumer construction | 14,553 | 10,818 | ||||
| Total Loans | $ | 1,038,864 | $ | 811,078 | ||
Credit Quality (at end of period):
| December 31, | December 31, | |||||
| 2018 | 2017 | |||||
| (Unaudited) | (Unaudited) | |||||
| Nonperforming Assets : | ||||||
| Nonaccrual loans | $ | 5,054 | $ | 2,388 | ||
| Loans past due 90 days or more | 23 | - | ||||
| Restructured loans | - | 180 | ||||
| Total nonperforming loans | 5,077 | 2,568 | ||||
| Other real estate owned | 3,119 | 3,558 | ||||
| Total nonperforming assets | $ | 8,196 | $ | 6,126 | ||
| Nonperforming loans as a % of loans | .49 | % | .32 | % | ||
| Nonperforming assets as a % of assets | .62 | % | .62 | % | ||
| Reserve for Loan Losses: | ||||||
| At period end | $ | 5,183 | $ | 5,079 | ||
| As a % of average loans | .55 | % | .64 | % | ||
| As a % of nonperforming loans | 102.09 | % | 197.78 | % | ||
| As a % of nonaccrual loans | 102.55 | % | 212.69 | % | ||
| Texas Ratio | 6.33 | % | 7.77 | % | ||
| Charge-off Information (year to date): | ||||||
| Average loans | $ | 941,221 | $ | 795,532 | ||
| Net charge-offs (recoveries) | $ | 396 | $ | 566 | ||
| Charge-offs as a % of average | ||||||
| loans, annualized | .04 | % | .07 | % | ||
MACKINAC FINANCIAL CORPORATION AND SUBSIDIARIES QUARTERLY FINANCIAL HIGHLIGHTS
| QUARTER ENDED | |||||||||||||||||||||
| (Unaudited) | |||||||||||||||||||||
| December 31 | September 30, | June 30 | March 31 | December 31 | |||||||||||||||||
| 2018 | 2018 | 2018 | 2018 | 2017 | |||||||||||||||||
| BALANCE SHEET (Dollars in thousands) | |||||||||||||||||||||
| Total loans | $ | 1,038,864 | $ | 993,808 | $ | 1,003,377 | $ | 812,441 | $ | 811,078 | |||||||||||
| Allowance for loan losses | (5,183 | ) | (5,186 | ) | (5,141 | ) | (5,101 | ) | (5,079 | ) | |||||||||||
| Total loans, net | 1,033,681 | 988,622 | 998,236 | 807,340 | 805,999 | ||||||||||||||||
| Total assets | 1,318,040 | 1,254,335 | 1,274,095 | 983,929 | 985,367 | ||||||||||||||||
| Core deposits | 947,040 | 885,988 | 844,894 | 602,601 | 631,644 | ||||||||||||||||
| Noncore deposits | 150,497 | 142,070 | 170,607 | 204,196 | 186,354 | ||||||||||||||||
| Total deposits | 1,097,537 | 1,028,058 | 1,015,501 | 806,797 | 817,998 | ||||||||||||||||
| Total borrowings | 60,441 | 69,216 | 91,747 | 80,002 | 79,552 | ||||||||||||||||
| Total shareholders' equity | 152,069 | 149,367 | 148,867 | 81,857 | 81,400 | ||||||||||||||||
| Total tangible equity | 124,325 | 124,605 | 123,974 | 74,303 | 73,784 | ||||||||||||||||
| Total shares outstanding | 10,712,745 | 10,712,745 | 10,712,745 | 6,332,560 | 6,294,930 | ||||||||||||||||
| Weighted average shares outstanding | 10,712,745 | 10,712,745 | 7,769,720 | 6,304,203 | 6,294,930 | ||||||||||||||||
| AVERAGE BALANCES (Dollars in thousands) | |||||||||||||||||||||
| Assets | $ | 1,320,996 | $ | 1,284,068 | $ | 1,117,188 | $ | 982,679 | $ | 996,966 | |||||||||||
| Loans | 1,043,409 | 1,001,763 | 905,802 | 810,688 | 808,306 | ||||||||||||||||
| Deposits | 1,087,174 | 1,042,004 | 913,220 | 805,092 | 817,338 | ||||||||||||||||
| Equity | 149,241 | 149,202 | 100,518 | 81,894 | 82,879 | ||||||||||||||||
| INCOME STATEMENT (Dollars in thousands) | |||||||||||||||||||||
| Net interest income | $ | 13,795 | $ | 13,214 | $ | 10,813 | $ | 9,309 | $ | 9,664 | |||||||||||
| Provision for loan losses | 300 | 50 | 100 | 50 | 225 | ||||||||||||||||
| Net interest income after provision | 13,495 | 13,164 | 10,713 | 9,259 | 9,439 | ||||||||||||||||
| Total noninterest income | 1,443 | 1,343 | 863 | 614 | 1,317 | ||||||||||||||||
| Total noninterest expense | 10,678 | 10,618 | 11,077 | 7,928 | 7,918 | ||||||||||||||||
| Income before taxes | 4,260 | 3,889 | 499 | 1,945 | 2,838 | ||||||||||||||||
| Provision for income taxes | 895 | 820 | 103 | 408 | 2,858 | ||||||||||||||||
| Net income available to common shareholders | $ | 3,365 | $ | 3,069 | $ | 396 | $ | 1,537 | $ | (20 | ) | ||||||||||
| Income pre-tax, pre-provision | $ | 4,560 | $ | 3,939 | $ | 599 | $ | 1,995 | $ | 3,062 | |||||||||||
| PER SHARE DATA | |||||||||||||||||||||
| Earnings | $ | .31 | $ | .29 | $ | .05 | $ | .24 | $ | - | |||||||||||
| Book value per common share | 14.20 | 13.94 | 13.90 | 12.96 | 12.93 | ||||||||||||||||
| Tangible book value per share | 11.61 | 11.63 | 11.57 | 11.73 | 11.72 | ||||||||||||||||
| Market value, closing price | 13.65 | 16.20 | 16.58 | 16.25 | 15.90 | ||||||||||||||||
| Dividends per share | .120 | .120 | .120 | .120 | .120 | ||||||||||||||||
| ASSET QUALITY RATIOS | |||||||||||||||||||||
| Nonperforming loans/total loans | .49 | % | .46 | % | .50 | % | .53 | % | .32 | % | |||||||||||
| Nonperforming assets/total assets | .62 | .53 | .59 | .70 | .62 | ||||||||||||||||
| Allowance for loan losses/total loans | .50 | .52 | .51 | .63 | .63 | ||||||||||||||||
| Allowance for loan losses/nonperforming loans | 102.09 | 114.58 | 102.31 | 117.48 | 197.78 | ||||||||||||||||
| Texas ratio | 6.33 | 5.14 | 5.80 | 6.87 | 7.77 | ||||||||||||||||
| PROFITABILITY RATIOS | |||||||||||||||||||||
| Return on average assets | 1.01 | % | .95 | % | .14 | % | .63 | % | (.01) | % | |||||||||||
| Return on average equity | 8.95 | 8.16 | 1.58 | 7.61 | (.10) | ||||||||||||||||
| Net interest margin | 4.64 | 4.60 | 4.26 | 4.19 | 4.18 | ||||||||||||||||
| Average loans/average deposits | 95.97 | 96.14 | 99.19 | 100.70 | 98.89 | ||||||||||||||||
| CAPITAL ADEQUACY RATIOS | |||||||||||||||||||||
| Tier 1 leverage ratio | 9.24 | % | 9.51 | % | 9.39 | % | 7.25 | % | 7.06 | % | |||||||||||
| Tier 1 capital to risk weighted assets | 11.95 | 12.62 | 11.87 | 8.79 | 8.66 | ||||||||||||||||
| Total capital to risk weighted assets | 12.47 | 13.17 | 12.39 | 9.43 | 9.29 | ||||||||||||||||
| Average equity/average assets (for the quarter) | 11.30 | 11.62 | 9.00 | 8.33 | 8.31 | ||||||||||||||||
| Tangible equity/tangible assets (at quarter end) | 9.64 | 10.13 | 9.92 | 7.62 | 7.55 | ||||||||||||||||
Contact: Jesse A. Deering, EVP & Chief Financial Officer (248) 290-5906 /jdeering@bankmbank.com
Website: www.bankmbank.com

Legal Disclaimer:
EIN Presswire provides this news content "as is" without warranty of any kind. We do not accept any responsibility or liability for the accuracy, content, images, videos, licenses, completeness, legality, or reliability of the information contained in this article. If you have any complaints or copyright issues related to this article, kindly contact the author above.
