
DIRTT Announces Strong Second Quarter Results

/EINPresswire.com/ -- CALGARY, ALBERTA -- (Marketwired) -- 08/03/16 -- DIRTT Environmental Solutions Ltd. ("DIRTT" or the "Company") (TSX: DRT), a leading technology-enabled designer, manufacturer and installer of fully customized, prefabricated interiors, today announced its financial results for the three and six-month periods ended June 30, 2016. This news release contains references to Canadian dollars and United States dollars. Canadian dollars are referred to as "$" and United States dollars are referred to as "US$".
Selected Highlights
For the three months ended June 30, 2016 the Company reported:
--  Revenue growth of 15.9% to $61.3 million versus the same prior year
    quarter;
--  Gross profit % increased by 410 basis points from 40.5% to 44.6% over Q2
    2015, and adjusted gross profit % (see "Non-IFRS Measures") also
    increased by 410 basis points to 46.1% over Q2 2015;
--  Completion of our largest and most successful DIRTT Connext™ (our
    annual sales, marketing and industry showcase) in June;
--  World premiere of ICEreality™, DIRTT's live, collaborative augmented
    reality technology;
--  Continuing investment in sales, marketing and business development with
    a year-over-year sales team headcount increase of 10.7%;
--  Adjusted EBITDA for the quarter of $4.4 million, representing an 89%
    increase over the prior year's Q2; and
--  Shipping trends and order entry momentum support expectations for
    continuing revenue growth in the next quarter.
For the six months ended June 30, 2016 the Company reported:
--  Revenue growth of 6.9% to $117.2 million versus the same prior year
    period, which is below expectations because of weaker than expected Q1
    2016 results;
--  Trailing 12-month revenue was $244.2 million versus $214.2 million in
    the prior 12-month period, an increase of 14.0%;
--  Gross profit % increased by 260 basis points from 41.3% to 43.9% over
    YTD 2015 and adjusted gross profit % (see "Non-IFRS Measures") also
    increased by 260 basis points to 45.3%;
--  Successful delivery of DIRTT's first major residential project - 16
    healthcare housing units in Barrow, Alaska;
--  Increasing investment by DIRTT's Distribution Partners including a 97%
    increase in Green Learning Center (display area) investments vs. YTD
    2015; and
--  Implemented DIRTT DP Movers program for high-performing partners.
"Our second quarter marked a return to strong growth and, with our most successful DIRTT Connext ever, laid a strong foundation for the second half of the year and into 2017," said Mogens Smed, DIRTT CEO. "We continue to invest in our Distribution Partners through the addition of sales and marketing resources to support our DPs' own growing sales teams; the DIRTT Movers Program to align our up-and-coming partners with our top-tier partners; and most importantly our increased investment in DIRTT Connext, which now spans two weeks. Our Partners in turn are increasing their investment in their businesses, leveraging DIRTT's commitment to them. Distribution Partner attendance at DIRTT Connext (which is at their own expense) increased by 55% over the prior year. All of this momentum was perhaps only surpassed by the unveiling of ICEreality™, live-interactive augmented reality for the built environment, once again showcasing our expanding technology lead in the world of construction."
"The second quarter saw a return to solid revenue growth and the third quarter is off to a strong start," said Scott Jenkins, President of DIRTT. "Of particular note was the strength in U.S. sales - our most important market - where our sales increased 24.7% versus the same quarter in 2015. We continue to diversify our business across multiple industry sectors and don't rely on any one industry or geographic market to drive growth. Consistent with overall macro-economic challenges in Canada, our Canadian revenue has been disappointing in the year thus far, and only represented 8.1% of total revenue in Q2. We are confident we will see improving results for this market as we enter the second half of the year and approach 2017."
Mogens Smed added, "We continue to accelerate our investment in our innovative solutions and technology and, working in concert with our Distribution Partners, increase our investment in sales, marketing and business development efforts with the addition of new team members, investment in DIRTT Connext and in our Distribution Partner support programs. While we are excited for the second half of the year we are focused on the longer term and increasing our penetration of the interior construction market where we believe we are still significantly less than 1% of the addressable market ."
                         Summary Financial Results
----------------------------------------------------------------------------
                                    Q2          Q2      Q2 YTD        Q2 YTD
                                  2016        2015        2016          2015
----------------------------------------------------------------------------
                                ($ thousands, except per share amounts)
Revenue                         61,252      52,866     117,175       109,567
Gross profit                    27,327      21,413      51,393        45,214
Gross profit %                   44.6%       40.5%       43.9%         41.3%
Adjusted gross profit (1)       28,226      22,225      53,035        46,736
Adjusted gross profit %
 (1)                             46.1%       42.0%       45.3%         42.7%
Selling, general and
 administrative ("SG&A")        27,543      22,544      50,689        42,615
SG&A %                           45.0%       42.6%       43.3%         38.9%
Adjusted SG&A (1)               23,566      19,809      42,815        37,237
Adjusted SG&A % (1)              38.5%       37.5%       36.5%         34.0%
Operating (loss) income          (216)     (1,131)         704         2,599
Adjusted EBITDA (1)              4,385       2,324       8,963        11,013
Adjusted EBITDA % (1)             7.2%        4.4%        7.6%         10.1%
Income tax expense                 987         245         958           467
Net (loss) income              (1,458)     (1,363)     (1,090)         3,319
Net (loss) income per
 share - basic and diluted      (0.02)      (0.02)      (0.01)          0.04
Cash flows provided by
 operating activities           13,668      12,684      14,936        16,945
Cash flows provided by
 operating activities (1)
 before changes in non-
 cash working capital            3,804       2,072       6,486        10,376
----------------------------------------------------------------------------
                                                      June 30,  December 31,
As at                                                     2016          2015
----------------------------------------------------------------------------

Cash and cash equivalents                               93,872        91,405
Working capital                                        100,033       103,858
Long-term debt                                          11,756         9,161
----------------------------------------------------------------------------
Note: (1) See "Non-IFRS Measures".
Revenue
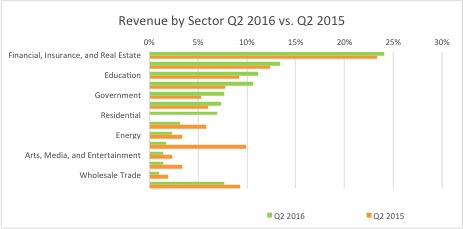
Revenue increased by $8.4 million, or 15.9%, for Q2 2016 compared with Q2 2015. The increase was partially due to the contribution of $4.3 million in revenue from the residential market during Q2 2016 (7% of total revenue) compared with nil in Q2 2015. The remainder of the increase was the result of a general increase in activity from small and medium-sized projects in Q2 2016, from a diverse range of industry segments. In addition, the stronger US dollar versus the comparable period in 2015 increased the Canadian dollar value of US revenue in Q2 2016.
Below is a breakdown of percentage revenue by sector for Q2 2016 versus Q2 2015:
http://media3.marketwire.com/docs/1064743b.jpg
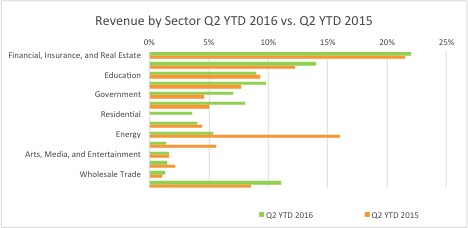
Revenue increased by $7.6 million, or 6.9%, for YTD 2016 compared with the same period in 2015. The 2015 period included revenue of $8.4 million from the previously announced US$30.0 million US energy sector contract compared to nil during the 2016 period. This business was partially offset by the $4.3 million contribution (4% of total revenue) from the residential market during the first half of 2016. While total volume was essentially flat year over year, the stronger US dollar versus the comparable period in 2015 increased the Canadian dollar value of US revenue. Sales to the energy sector accounted for 5% of total revenue in 2016, down from 15% of total revenue for the same period in 2015. The reduction reflects the absence of contribution from the previously announced US$30.0 million contract and a general decline in activity in this sector as a result of falling energy prices. This decline was offset by increases in revenue from other sectors.
Below is a breakdown of percentage revenue by sector for YTD 2016 versus YTD 2015:
http://media3.marketwire.com/docs/1064743a.jpg
Gross Profit / Adjusted Gross Profit / Gross Profit % / Adjusted Gross Profit %
Gross profit for Q2 2016 improved to $27.3 million from $21.4 million in Q2 2015, with gross profit % widening 410 basis points to 44.6% from 40.5%. Adjusted gross profit for Q2 2016 improved to $28.2 million from $22.2 million for Q2 2015, with adjusted gross profit % widening 410 basis points to 46.1% from 42.0%. The increase in gross and adjusted gross profit % were due primarily to higher revenue, combined with steady monthly manufacturing volumes and favorable product mix, resulting in reduced material and direct labor costs in 2016 compared with 2015. During Q2 2016, material costs and direct labor costs as a percentage of revenue improved by 230 basis points and 40 basis points, respectively, compared with 2015.
Gross profit for YTD 2016 improved to $51.4 million from $45.2 million for the same period in 2015, with gross profit % widening 260 basis points to 43.9% from 41.3%. Adjusted gross profit for YTD 2016 improved to $53.0 million from $46.7 million for the same period in 2015, with adjusted gross profit % widening 260 basis points to 45.3% from 42.7%. Relatively steady manufacturing volumes throughout the first half of 2016, combined with a diverse project mix, contributed to the increase in gross profit % in 2016.
The higher US dollar to Canadian dollar exchange rate also contributed to increased gross profit and adjusted gross profit in 2016, as the positive impact on US dollar revenue exceeded the negative impact on US dollar-based production costs. US dollar-based production costs include those costs incurred at our manufacturing facilities in Savannah, Georgia and Phoenix, Arizona. Additionally, some of our largest raw material costs incurred in all of our manufacturing facilities are also denominated in US dollars.
SG&A Expenses / Adjusted SG&A Expenses / SG&A % / Adjusted SG&A %
Selling, general and administrative ("SG&A") % increased by 240 basis points from 42.6% to 45.0% in Q2 2016 compared with Q2 2015. SG&A expenses increased by $5.0 million, or 22.2%, for Q2 2016 compared with Q2 2015. The increase reflects DIRTT's ongoing investment in long-term growth. The most significant change can be attributed directly to marketing-related efforts as travel, marketing and trade show costs increased by $1.8 million, of which $1.1 million was related to the previously mentioned DIRTT Connext event. The increased investment in DIRTT Connext can be attributed directly to the 55% increase in DP attendance at this year's event. While our DPs and their team members are responsible for their own travel and accommodation costs to attend the event, DIRTT incurs costs for the training sessions, keynote speakers, facilities, meals and entertainment and travel and accommodation costs for DIRTT personnel. Other increases in SG&A in Q2 2016 included depreciation and amortization expense of non-manufacturing-related assets of $0.7 million, stock-based compensation expense of $0.6 million, salaries and commissions of $0.5 million, professional fees of $0.4 million, rent expense of $0.3 million, and $0.7 million in other operating expense items.
Adjusted SG&A % increased by 100 basis points from 37.5% to 38.5% in Q2 2016 compared with Q2 2015. Adjusted SG&A expenses increased by $3.7 million, or 19.0%, for Q2 2016 compared with Q2 2015. The reason for the increase is the same as discussed above with respect to SG&A, excluding the impact from increased non-cash depreciation and amortization of non-manufacturing-related assets and stock-based compensation expense incurred in the period.
SG&A % increased by 440 basis points from 38.9% to 43.3% in YTD 2016 compared with the same period in 2015. SG&A expenses increased by $8.1 million, or 18.9%, for YTD 2016 compared with the same period in 2015. The increase reflects DIRTT's ongoing investment in long-term growth. The most significant changes can be attributed directly to marketing-related efforts as travel, marketing and trade show costs increased by $2.8 million, of which $1.1 million was related to the previously mentioned DIRTT Connext event, and marketing promotional items increased by $0.2 million. Other increases in SG&A in YTD 2016 included depreciation and amortization expense of non-manufacturing-related assets of $1.4 million, stock-based compensation expense of $1.1 million, software licenses and computer supplies of $0.6 million, rent expense of $0.5 million, salaries and commissions of $0.3 million, professional service fees of $0.2 million, and $1.0 million in other operating expense items.
Adjusted SG&A % increased by 250 basis points from 34.0% to 36.5% in YTD 2016 compared with the same period in 2015. Adjusted SG&A expenses increased by $5.6 million, or 15.0%, for YTD 2016 compared with the same period in 2015. The reason for the increase is the same as discussed above with respect to SG&A, excluding the impact from increased non-cash depreciation and amortization of non-manufacturing-related assets and stock-based compensation expense in the year.
The higher US dollar to Canadian dollar exchange rate also contributed to the overall increase in SG&A and adjusted SG&A expenses across the organization for 2016, as certain of these expenditures are denominated in US dollars.
Adjusted EBITDA / Adjusted EBITDA %
Adjusted EBITDA % for Q2 2016 improved by 280 basis points from 4.4% in Q2 2015 to 7.2%. Adjusted EBITDA increased by $2.1 million, or 88.7%, for Q2 2016 compared with Q2 2015. The increase in Q2 2016 was mainly due to higher adjusted gross profit of $6.0 million, partially offset by higher adjusted SG&A expenses of $3.7 million and an increase in foreign exchange loss of $0.2 million.
Adjusted EBITDA % for YTD 2016 weakened by 250 basis points from 10.1% in YTD 2015 to 7.6%. Adjusted EBITDA decreased by $2.1 million, or 18.6%, for YTD 2016 compared with the same period in 2015. The decrease in YTD 2016 was mainly due to the increase in foreign exchange loss of $2.8 million and higher adjusted SG&A expenses of $5.6 million, partially offset by higher adjusted gross profit of $6.3 million.
Gains or losses in foreign exchange ("FX") are primarily the result of the period end revaluation of monetary assets and liabilities held within our Canadian companies. The largest component of these assets and liabilities is our holdings of US dollar cash and cash equivalents. The increase in foreign exchange loss of $2.8 million is the result of significant fluctuations in the CAD-US exchange rate in the year-over-year periods. In the first half of 2015, the US dollar increased by $0.09, resulting in a $1.5 million gain on the revaluation of these monetary assets and liabilities. Conversely, in the first half of 2016, the US dollar depreciated by $0.09, resulting in a $1.3 million loss being recognized. These amounts exclude any gains or losses resulting from the revaluation of our US dollar-denominated long-term debt, as these amounts have been added back in the determination of Adjusted EBITDA as per reconciliation below.
                              Q2      Q2            Q2 YTD  Q2 YTD
                            2016    2015  Variance    2016    2015  Variance
                        ----------------------------------------------------
                                            ($ thousands)
FX loss (gain) as
 reported                    341     (2)       343   1,006 (1,215)     2,221
FX loss (gain) on debt
 revaluation                  11    (94)       105   (306)     299     (605)
                        ----------------------------------------------------
FX loss (gain) included
 in Adjusted EBITDA          330      92       238   1,312 (1,514)     2,826
                        ----------------------------------------------------
Board Update
DIRTT assesses best practices with respect to corporate governance on a regular basis. As part of this process we have implemented changes to our Board Committee structure both during the quarter and subsequent to quarter end. Effective June 22, 2016, Scott Jenkins has stepped down from the Corporate Governance Committee. Effective August 3, 2016, Gregory Burke has stepped down from the Compensation Committee and Denise Turner has joined the Compensation Committee.
Outlook
Our growth strategy consists of five key initiatives: (1) increasing penetration of existing markets by providing continued support and increased investment to our existing DPs throughout North America; (2) expanding into new geographies, such as the Middle East and United Kingdom, by capitalizing on recent and continued investment alongside new international DPs; (3) penetrating new vertical markets such as the healthcare, education and residential sectors; (4) continuing to invest in ICE and new innovative interior construction solutions such as the Enzo Approach, residential interiors and timber frame construction; and (5) partnering with industry leaders to monetize innovative solutions.
Our previously announced programs to support our top-tier and next tier Distribution Partners, such as the DIRTT Movers Program, DIRTT Green Learning Center loan program, increasing investment in product development and ICE development are contributing to the momentum we are seeing as we start the second half of the year. Our unveiling of ICEreality™, bringing augmented reality to the construction industry, will change, we believe, the way people design, create, collaborate and build interiors. We believe the increasing investment our Distribution Partners are making in our business, with the addition of staff, increased investment in Green Learning Centers and their increased investment in DIRTT Connext, where their attendance was up 55%, is a strong indication of the long-term prospects for our business.
We believe DIRTT Solutions and the resulting more efficient and cost-effective construction experience are a superior alternative to conventional construction across all sectors of the construction industry, and that a continued increase in global construction activity can be expected to result in an ongoing improvement to our revenue. We plan to invest additional resources, including continuing to develop and expand ICE and new DIRTT Solutions and test projects, to pursue further opportunities in the healthcare, education, government, corporate and residential sectors of the construction industry.
Liquidity and Capital Resources
At June 30, 2016, we had $93.9 million in cash and cash equivalents compared with $91.4 million at December 31, 2015.
At June 30, 2016, we also had access to an undrawn US$18.0 million revolving credit facility. In March 2016, we signed a fourth amendment to the amended and restated loan agreement with our lenders which, among other things, provided us with an additional capital financing facility of US$10.0 million, of which $5.3 million (US$4.2 million) was drawn as at June 30, 2016. We expect to draw on the remainder of this facility by December 31, 2016.
Non-IFRS Measures
Adjusted gross profit, Adjusted gross profit %, Adjusted SG&A, Adjusted SG&A %, Adjusted EBITDA, Adjusted EBITDA % and cash provided by operating activities before changes in non-cash working capital are non-IFRS measures. Non-IFRS measures do not have a standard meaning as prescribed by IFRS, and are therefore unlikely to be comparable to similar measures presented and calculated by other companies. DIRTT believes the non-IFRS measures are useful supplemental measures that may assist investors in assessing DIRTT's business. The non-IFRS measures should not be considered as the sole measure of the Company's performance and should not be considered in isolation from, or as a substitute for, analysis of its financial statements. For a reconciliation of these non-IFRS measures as well as the rationale for management's use of such measures, see the Company's management's discussion and analysis for the three and six-month periods ended June 30, 2016, available at http://www.sedar.com.
Conference Call Details
DIRTT will host a conference call and webcast on Thursday, August 4, 2016 at 9 a.m. ET, 7 a.m. MT to discuss its first quarter results in greater detail. President Scott Jenkins and CFO Derek Payne will host the call.
To access the conference call by telephone dial +1 647.427.7450 (Toronto and international callers) or 1.888.231.8191 (toll-free in North America). Please call 10 minutes prior to the start of the call. In addition, a live webcast (listen only mode) of the conference call will be available at:
http://event.on24.com/r.htm?e=1225965&s=1&k=EAA0E2E4B1691E38955292BB4EE81543
Investors are invited to submit questions by email before and during the conference call. Please send them to ir@dirtt.net.
A replay of the conference call will be available at +1 416.849.0833 or 1.855.859.2056 by entering the passcode 50378584, from noon (ET) Thursday, August 4, 2016 to midnight (ET) Thursday, August 11, 2016 or through the webcast archives at http://www.newswire.ca or on DIRTT's website at www.dirtt.net/company/investor.
About DIRTT
DIRTT Environmental Solutions (Doing it Right This Time) uses its proprietary 3D software to design, manufacture and install fully customized prefabricated interiors. The Company's customers in the corporate, government, education and healthcare sectors benefit from DIRTT's precise design and costing; rapid lead times with the highest levels of customization and flexibility; and faster, cleaner construction.
DIRTT's manufacturing facilities are in Phoenix, Savannah, Kelowna and Calgary. DIRTT's team supports more than 100 Distribution Partners throughout North America, the Middle East and Asia. DIRTT trades on the Toronto Stock Exchange under the symbol "DRT." For more information visit www.dirtt.net.
Forward-Looking Statements
Certain information and statements contained in this news release constitute "forward-looking information" and "forward-looking statements" (collectively, "Forward-Looking Information") as defined under applicable Canadian securities laws and the Company hereby cautions investors about important factors that could cause the Company's actual results or outcomes to differ materially from those projected in any Forward-Looking Information contained in this news release. Any statements that express, or involve discussions as to, expectations, beliefs, plans, objectives, assumptions or future events or performance (often, but not always, through the use of words or phrases such as "will likely result", "are expected to", "will continue", "is anticipated", "believes", "estimated", "intends", "plans", "projection" and "outlook"), are not historical facts and may be forward-looking and may involve estimates, assumptions and uncertainties which could cause actual results or outcomes to differ materially from those expressed in such Forward-Looking Information.
In particular and without limitation, this news release contains Forward-Looking Information pertaining to the following: comments with respect to the Company's revenue, objectives and priorities for 2016 and beyond; comments with respect to shipping trends, order entry momentum and revenue growth expectations for the third quarter and the second half of 2016; project timetables; the benefits of the DIRTT Movers Program; the anticipated use of its credit facilities, comments with respect to the new GLC in London, United Kingdom; its growth strategies and opportunities; its ability to meet working capital requirements and financial obligations; use and deployment of the Company's capital; and its outlook for its operations and the Canadian, US and international economies, and in particular, the US construction industry.
With respect to Forward-Looking Information contained in this news release, assumptions have been made regarding the Company, among other things:
--  its ability to manage its growth;

--  competition in its industry;

--  its ability to enhance current products and develop and introduce new
    products;

--  its ability to obtain components and products from suppliers on a timely
    basis and on favorable terms;

--  its ability to obtain qualified staff and equipment in a timely and
    cost-efficient manner;

--  the regulatory framework governing taxes in Canada and the US and any
    other jurisdictions in which the Company may conduct its business in the
    future;

--  future development plans for its assets unfolding as currently
    envisioned;

--  future capital expenditures to be made by the Company;

--  future sources of funding for its capital program;

--  the impact of increasing competition on the Company; and

--  its success in identifying risks to its business and managing the risks
    mentioned below.
The Company's actual results or outcomes could differ materially from those expressed in the Forward-Looking Information as a result of the risks normally encountered in its industry such as:
--  maintaining and managing growth;

--  history of losses;

--  risks related to new technology;

--  competition risks;

--  operating results and financial condition fluctuations on a quarterly
    and annual basis;

--  risks related to intellectual property;

--  risks related to additional capital requirements;

--  customer base and market acceptance;

--  software and product defects and design risks;

--  availability of key supplies;

--  dependence on key personnel;

--  commodity price risk;

--  credit risk;

--  the effect of government regulation;

--  risks related to international expansion;

--  risks related to physical facilities;

--  legal risks;

--  foreign currency and fiscal matters;

--  risks related to future acquisitions;

--  risks related to Forward-Looking Information;

--  reliance on third parties; and

--  conflicts of interest.
Since actual results or outcomes could differ materially from those expressed in the Forward-Looking Information provided by or on behalf of the Company, investors and others should not place undue reliance on any such Forward- Looking Information.
DIRTT cautions that the foregoing lists of factors are not exhaustive. Further, Forward-Looking Information is made as of the date hereof, and the Company undertakes no obligation to update Forward-Looking Information to reflect events or circumstances after the date on which such statement is made or to reflect the occurrence of unanticipated events, except as required by applicable Canadian securities laws. New factors emerge from time to time, and it is not possible for DIRTT's management to predict all of these factors and to assess in advance the impact of each such factor on the Company's business or the extent to which any factor, or combination of factors, may cause actual results to differ materially from those contained in Forward-Looking Information. No assurance can be given that these expectations will prove to be correct and such Forward-Looking Information contained in this news release should not be unduly relied upon. In addition, this news release may contain Forward-Looking Information attributed to third party industry sources.
For a detailed description of the risks and uncertainties facing the Company and its business and affairs, readers should refer to the Company's annual financial statements, management's discussion and analysis and annual information form for the year ended December 31, 2015, all of which are available at http://www.sedar.com.
Market and Industry Data
Certain market and industry data contained in this news release is based upon information from government or other third party publications, reports and websites or based on estimates derived from such publications, reports and websites. Government and other third party publications and reports do not guarantee the accuracy or completeness of their information. While the Company believes this data to be reliable, market and industry data is subject to variations and cannot be verified with complete certainty due to limits on the availability and reliability of raw data, the voluntary nature of the data-gathering process and other limitations and uncertainties inherent in any statistical survey.
Contacts:
DIRTT Environmental Solutions
Scott Jenkins
President
sjenkins@dirtt.net
403.723.5009
DIRTT Environmental Solutions
Derek Payne
Chief Financial Officer
dpayne@dirtt.net
403.313.9879
www.dirtt.net
Legal Disclaimer:
EIN Presswire provides this news content "as is" without warranty of any kind. We do not accept any responsibility or liability for the accuracy, content, images, videos, licenses, completeness, legality, or reliability of the information contained in this article. If you have any complaints or copyright issues related to this article, kindly contact the author above.
