
The 2021-24 inflation surge through the lens of the ECB-BASE model
Prepared by Elena Angelini, Matthieu Darracq Pariès and Srečko Zimic
Published as part of the ECB Economic Bulletin, Issue 3/2025.
The implications of Russia’s war on Ukraine, which were not anticipated in the December 2021 Eurosystem staff macroeconomic projections for the euro area, led to large projection errors in 2022.[1] The error in HICP inflation vis-à-vis the December 2021 projection was close to 8 percentage points at the end of 2022, while the error in GDP growth was smaller – but also substantial –, standing at almost 1 percentage point (Chart A).
Economic models such as the ECB-BASE model similarly exhibited forecast errors, although it remains unclear whether these arose from model limitations or unpredictable shocks. Along these lines, forecasts generated by the ECB-BASE model using the same assumptions as the December 2021 Eurosystem staff Broad Macroeconomic Projection Exercise (BMPE) would also have resulted in significant errors (Chart A).[2] To investigate this, we compare two model-based forecasts from December 2021 – the actual real time forecast and a counterfactual forecast – in which we assume that the actual developments in HICP energy and food prices and other technical assumptions over the projection horizon from 2022 to 2024 were known at the time.[3] The deviation between the counterfactual inflation forecast and the actual inflation rate is therefore not related to unexpected developments in HICP energy or food prices or changes in the technical assumptions for fiscal policy, financial conditions – including monetary policy – and the external environment. If, having considered all these factors, a residual remains, it could reflect other unanticipated economic developments, measurement errors or model misspecifications.
Chart A
Counterfactual forecasts for euro area HICP inflation and GDP growth since the December 2021 BMPE using the ECB-BASE model
(annual percentage point changes)

Source: ECB staff calculations using the ECB-BASE model.
Notes: “Model-based forecasts + ex post assumptions” are simulated using the ECB-BASE forecasts from the December 2021 BMPE, but imposing the realised paths for HICP energy, HICP food and other technical assumptions, as well as conditioning on the short-term outlook. For further details see Section 4.3 in Angelini et al., op. cit.
Approximately 70% of HICP inflation forecast errors for the fourth quarter of 2022 can be attributed to unexpected developments in energy and food prices. In Chart B, we show a decomposition of the forecast errors into different factors. Initially, the modified assumptions for energy prices (dark blue and yellow bars) have the largest impact on both inflation and real GDP errors in 2022.[4] Food prices (red bars) become relatively more important in 2023, also reflecting the delayed response to energy prices and the effects of Russia’s war on Ukraine. The unanticipated discretionary fiscal measures that were taken to alleviate the cost-of-living crisis following the increase in energy prices made a negative contribution to the forecast error for inflation in 2023. This was then reversed in early 2024 with the removal of some of these measures (dark green bars). The unexpected changes in external assumptions (light blue bars) over the 2022-24 horizon made a somewhat limited contribution to both inflation and output forecast errors. Tighter financial assumptions (light green bars; with a significantly higher short-term interest rate path) contributed substantially to the GDP forecast error in 2023, while the impact of financial assumptions on the inflation forecast error was minimal and delayed, largely because the exercise did not fully account for monetary policy transmission, as discussed below. Finally, the grey bars depict the remaining factors, including possible unanticipated economic developments, measurement errors and model misspecifications.
Chart B
Breakdown of counterfactual forecasts for euro area HICP inflation and GDP growth using the ECB-BASE model
a) HICP inflation
(year-on-year percentage changes, percentage points)

b) Real GDP
(year-on-year percentage changes, percentage points)

Source: ECB staff calculations and simulations using the ECB-BASE model.
Notes: “Forecast error” refers to the overall total forecast error using the ECB-BASE model; “Counterfactual” refers to the error explained by the model simulation.
Forecast errors in core inflation can best be reduced through capturing stronger second-round effects than those estimated in the model. The remaining errors in the headline HICP inflation forecast stem from the underprediction of core prices. This underprediction could be explained by the limited pass-through of energy prices to other prices in the model and may reflect non-linearities, namely a change in the historical pass-through to other prices given the substantial size of the energy and food price shocks. Chart C (red bars) illustrates how the average forecast error in core inflation diminishes by about 60% when the energy pass-through is increased. In addition, part of the error in headline HICP inflation can be explained by mispredicted wage and employment growth. The model would have predicted a decrease in wages and employment because of the substantial real economic downturn following the deterioration in terms of trade resulting from higher energy and food prices and the impact of tightening financing conditions; nonetheless, nominal wages and employment showed a fairly strong increase. Additionally, accounting for tighter wage-price linkages and greater labour hoarding substantially improves the performance of the model forecasts (Chart C, light blue bars).
Chart C
Explaining the unexplained part of the forecast errors
(quarter-on-quarter percentage changes

Source: ECB staff calculations and simulations using the ECB-BASE model.
Notes: Technical modifications explored in the model to address the remaining errors in Chart B include: (1) wage indexation adjustment: the coefficient that determines the impact of past consumer price inflation on wages was adjusted upwards by 25%, to better reflect the strong link observed between past inflation and wage adjustments during this period; (2) higher pass-through: a re-calibration of the Phillips curve parameters was carried out within the model to enhance the transmission from energy prices to marginal costs and the GDP deflator, aiming to achieve a more responsive pass-through mechanism; and (3) labour hoarding: a labour demand shock was implemented to break Okun’s law and decouple labour demand from the observed fall in output, reflecting the unexpected resilience of the labour market. These adjustments improve the model’s fit with respect to the economic behaviours seen during the period under review, particularly in relation to the responses of core prices, wages and employment to inflationary pressures. When all of these additional factors are included, the size of the grey bars in Chart B (other factors) decreases significantly.
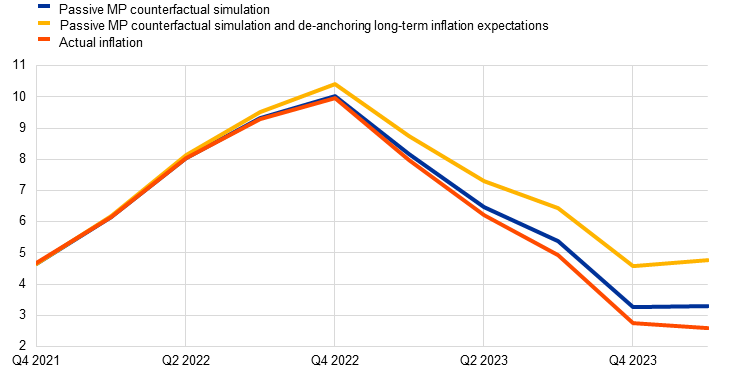
When considering a more comprehensive set of propagation mechanisms, including the possible de-anchoring of long-term inflation expectations, monetary policy plays a crucial role in stabilising inflation in the medium term. From Chart B, it appears that changes in financial assumptions alone do not significantly contribute to lowering inflation. However, this analysis only considers the mechanical effects of changes in financial assumptions such as interest rates. It does not account for all endogenous propagation channels of monetary policy, for instance, the impact of interest rate changes on the exchange rate, as the exchange rate is treated as an external assumption in this type of analysis. We carried out a standard monetary policy counterfactual simulation, assuming that short-term rates remained at the levels projected in the December 2021 BMPE, owing to monetary policy shocks, and that all the other responses are driven by the model’s endogenous mechanisms.[5] As observed in Chart D, without monetary policy intervention, inflation could have been 0.7 percentage points higher at the end of 2024. Additionally, the strong monetary policy response played a key role in anchoring inflation expectations. Using de-anchored expectations – which are more influenced by past inflation than by the central bank’s target – inflation would have been 2 percentage points higher in 2024 (Chart D), turning a transitory shock into a more persistent one.[6]
Chart D
ECB-BASE model counterfactuals to evaluate the impact of monetary policy
HICP inflation
(annual percentage change)
Source: ECB staff calculations and simulations using the ECB-BASE model.
Notes: “MP” stands for monetary policy. The red line represents actual inflation. The blue line shows counterfactual inflation assuming that interest rates remained at the levels projected in the December 2021 BMPE, reflecting a passive monetary policy. The yellow line illustrates counterfactual inflation in a scenario in which long-term inflation expectations become de-anchored, such as the episode of high inflation following the energy shocks in the United States in the 1970s.
Legal Disclaimer:
EIN Presswire provides this news content "as is" without warranty of any kind. We do not accept any responsibility or liability for the accuracy, content, images, videos, licenses, completeness, legality, or reliability of the information contained in this article. If you have any complaints or copyright issues related to this article, kindly contact the author above.
