

LexinFintech Holdings Ltd. Reports First Quarter Unaudited Financial Results
SHENZHEN, China, May 24, 2023 (GLOBE NEWSWIRE) -- LexinFintech Holdings Ltd. (“Lexin” or the “Company”) (NASDAQ: LX), a leading technology-empowered personal financial service enabler in China, today announced its unaudited financial results for the quarter ended March 31, 2023.
"Total loan origination for the first quarter of 2023 beat our initial expectations of over RMB60.9 billion, representing a year-over-year growth of 41.2%. Moreover, our total outstanding loan balance was over RMB107 billion, an increase of 27.7% year-over-year," said Jay Wenjie Xiao, chairman and chief executive officer of Lexin. "We delivered a solid result in the first quarter of 2023 and are well on track for a robust V-shaped recovery, which attributes to the recovery of consumption after the Chinese New Year and our continued efforts on risk management upgrade and operational improvement initiatives."
"In the past quarter, we made it the corporate priority number one to sharpen our focus on upgrading our overall risk management capability. Tangible improvement in asset quality is a clear reflection of these changes and we are committed to continue with this essential endeavor. Additionally, we further stepped up our investments in technological innovation and optimizing operational efficiency. Our efforts result in the enhancement of overall core competencies. Looking ahead, we remain vigilant about the continued recovery in consumption and economic activities in China. Risk management has long been the front and center of our business and we will continue to maintain a prudent approach in terms of business growth for this year," Mr. Xiao continued.
"We entered the 2023 financial year with a solid first-quarter result, which serves as a strong testament to the continued turnaround of our business," said Mr. James Zheng, chief financial officer of Lexin. "Total operating revenue for the first quarter was RMB3.0 billion, an increase of 74.2% year-over-year, and a decrease of 2.2% quarter-on-quarter, and our net profit also continued to increase for the fourth consecutive quarter, reaching approximately RMB327 million, an increase of 302% year-over-year and 8.7% quarter-on-quarter. Net profit margin increased to 11.0% from 4.8% in the first quarter of 2022 and 9.9% in the fourth quarter of 2022. Reduction in funding cost, improvements in operational efficiency, major upgrades in risk management system and switching more towards better quality customers, all contributed to a strong performance this quarter.
Quarter to date, we saw mild loan volume growth of our business as well as some enhancement in risk management, customer acquisition, funding cost and operational optimization. Looking ahead, we remain dedicated to generating sustainable, high-quality business growth and creating long-term value for our customers, shareholders and other stakeholders across our Lexin consumption ecosystem," said Mr. Zheng.
First Quarter 2023 Operational Highlights:
- Total number of registered users reached 194 million as of March 31, 2023, representing an increase of 13.7% from 171 million as of March 31, 2022, and users with credit lines reached 40.5 million as of March 31, 2023, up by 7.1% from 37.8 million as of March 31, 2022.
- As of March 31, 2023, we cumulatively originated RMB923.5 billion in loans, an increase of 31.5% from RMB702.2 billion a year ago.
User Base
- Number of active users1 who used our loan products in the first quarter of 2023 was 5.0 million, representing a decrease of 11.8% from 5.7 million in the first quarter of 2022.
- Number of new active users who used our loan products in the first quarter of 2023 was 0.4 million, representing a decrease of 42.6% from 0.7 million in the first quarter of 2022.
Loan Facilitation Business
- Total loan originations2 in the first quarter of 2023 was RMB60.9 billion, an increase of 41.2% from RMB43.2 billion in the first quarter of 2022.
- Total outstanding principal balance of loans2 reached RMB107 billion as of March 31, 2023, representing an increase of 27.7% from RMB83.8 billion as of March 31, 2022.
- Total number of orders placed on our platform in the first quarter of 2023 was 23.7 million, representing a decrease of 15.0% from 27.9 million in the first quarter of 2022.
Credit Performance
- 90 day+ delinquency ratio was 2.53% as of March 31, 2023, as compared with 2.53% as of December 31, 2022.
- 30 day+ delinquency ratio was 4.57% as of March 31, 2023, as compared with 4.62% as of December 31, 2022.
- First payment default rate (30 day+) for new loan originations was below 1% as of March 31, 2023.
Tech-empowerment Service
- For the first quarter of 2023, we served over 110 business customers with our tech-empowerment service.
- In the first quarter of 2023, the business customer retention rate3 of our tech-empowerment service was over 80%.
Installment E-commerce Platform Service
- GMV4 in the first quarter of 2023 for our installment e-commerce platform service was RMB1,129 million, representing an increase of 68.8% from RMB669 million in the first quarter of 2022.
- In the first quarter of 2023, our installment e-commerce platform service served over 400,000 users and 900 merchants.
Other Operational Highlights
- The weighted average tenor of loans originated on our platform in the first quarter of 2023 was approximately 15.1 months, as compared with 12.3 months in the first quarter of 2022. The nominal APR5 was 17.1% for the first quarter of 2023, as compared with 14.4% in the first quarter of 2022.
First Quarter 2023 Financial Highlights:
- Total operating revenue was RMB2,983 million, representing an increase of 74.2% from the first quarter of 2022.
- Credit facilitation service income was RMB2,116 million, representing an increase of 136% from the first quarter of 2022. Tech-empowerment service income was RMB368 million, representing a decrease of 26.0% from the first quarter of 2022. Installment e-commerce platform service income was RMB499 million, representing an increase of 56.6% from the first quarter of 2022.
- Net income attributable to ordinary shareholders of the Company was RMB327 million, representing an increase of 319% from the first quarter of 2022. Net income per ADS attributable to ordinary shareholders of the Company was RMB1.83 on a fully diluted basis.
- Adjusted net income attributable to ordinary shareholders of the Company6 was RMB375 million, representing an increase of 190% from the first quarter of 2022. Adjusted net income per ADS attributable to ordinary shareholders of the Company6 was RMB2.00 on a fully diluted basis.
__________________________
- Active users refer to, for a specified period, users who made at least one transaction during that period through our platform or through our third-party partners’ platforms using the credit line granted by us.
- Originations of loans and outstanding principal balance represent the origination and outstanding principal balance of both on- and off-balance sheet loans.
- Customer retention rate refers to the number of financial institution customers and partners who repurchase our service in the current quarter as a percentage of the total number of financial institution customers and partners in the preceding quarter.
- GMV refers to the total value of transactions completed for products purchased on our e-commerce and Maiya channel, net of returns.
- Nominal APR refers to all-in interest costs and fees to the borrower over the net proceeds received by the borrower as a percentage of the total loan originations of both on- and off-balance sheet loans.
- Adjusted net income attributable to ordinary shareholders of the Company, adjusted net income per ordinary share and per ADS attributable to ordinary shareholders of the Company are non-GAAP financial measures. For more information on non-GAAP financial measures, please see the section of “Use of Non-GAAP Financial Measures Statement” and the tables captioned “Unaudited Reconciliations of GAAP and Non-GAAP Results” set forth at the end of this press release.
First Quarter 2023 Financial Results:
Operating revenue increased by 74.2% from RMB1,712 million in the first quarter of 2022 to RMB2,983 million in the first quarter of 2023.
Credit facilitation service income increased by 136% from RMB896 million in the first quarter of 2022 to RMB2,116 million in the first quarter of 2023. The increase was driven by increases in loan facilitation and servicing fees-credit oriented, guarantee income and financing income.
Loan facilitation and servicing fees-credit oriented increased by 277% from RMB256 million in the first quarter of 2022 to RMB964 million in the first quarter of 2023. The increase was primarily due to the significant increase in off-balance sheet loans originated under the credit-oriented model.
Guarantee income increased by 118% from RMB254 million in the first quarter of 2022 to RMB554 million in the first quarter of 2023. The increase was primarily driven by the increase in loan originations and the increase of outstanding balances in the off-balance sheet loans funded by certain institutional funding partners, which are accounted for under ASC 460, Guarantees.
Financing income increased by 54.6% from RMB387 million in the first quarter of 2022 to RMB598 million in the first quarter of 2023. The increase was primarily driven by the increase in the origination of on-balance sheet loans.
Tech-empowerment service income decreased by 26.0% from RMB497 million in the first quarter of 2022 to RMB368 million in the first quarter of 2023. The decrease was primarily due to the decrease in APR of loans originated under the profit-sharing model within tech-empowerment service in the first quarter of 2023.
Installment e-commerce platform service income increased by 56.6% from RMB319 million in the first quarter of 2022 to RMB499 million in the first quarter of 2023. The increase was primarily driven by the increase in transaction volume in the first quarter of 2023.
Cost of sales increased by 42.1% from RMB328 million in the first quarter of 2022 to RMB466 million in the first quarter of 2023, which was consistent with the increase in installment e-commerce platform service income.
Funding cost increased by 59.6% from RMB94.3 million in the first quarter of 2022 to RMB150 million in the first quarter of 2023, which was consistent with the increase in funding debts to fund the on-balance sheet loans.
Processing and servicing costs increased by 14.4% from RMB462 million in the first quarter of 2022 to RMB529 million in the first quarter of 2023. This increase was primarily due to an increase in risk management and collection expenses.
Provision for financing receivables was RMB139 million for the first quarter of 2023, as compared to RMB45.5 million for the first quarter of 2022. The credit losses reflect the most recent performance in relation to the Company’s on-balance sheet loans.
Provision for contract assets and receivables was RMB142 million in the first quarter of 2023, as compared to RMB71.2 million in the first quarter of 2022. The increase was primarily due to the significant increase in loan facilitations and servicing fees in the first quarter of 2023.
Provision for contingent guarantee liabilities was RMB653 million in the first quarter of 2023, as compared to RMB250 million in the first quarter of 2022. The increase was primarily due to the increase in loan origination of the off-balance sheet loans funded by certain institutional funding partners, which are accounted for under ASC 460, Guarantees.
Gross profit increased by 96% from RMB461 million in the first quarter of 2022 to RMB903 million in the first quarter of 2023.
Sales and marketing expenses increased by 22.1% from RMB360 million in the first quarter of 2022 to RMB440 million in the first quarter of 2023. This increase was primarily due to an increase in online advertising costs.
Research and development expenses decreased by 15.1% from RMB153 million in the first quarter of 2022 to RMB130 million in the first quarter of 2023, as a result of the Company’s improved efficiency.
General and administrative expenses decreased by 17.1% from RMB117 million in the first quarter of 2022 to RMB97.0 million in the first quarter of 2023, as a result of the Company’s expense control measures.
Change in fair value of financial guarantee derivatives and loans at fair value was a gain of RMB156 million in the first quarter of 2023, as compared to a gain of RMB263 million in the first quarter of 2022. The change in fair value was primarily driven by the fair value gains realized as a result of the release of guarantee obligation, along with the re-measurement of the expected loss rates and changes in the balances of the underlying outstanding off-balance sheet loans as of March 31, 2023.
Income tax expense increased by 283% from RMB19.4 million in the first quarter of 2022 to RMB74.3 million in the first quarter of 2023. The increase in income tax expense was consistent with the increase in the income before income tax expense in the first quarter of 2023.
Net income increased by 302% from RMB81.5 million in the first quarter of 2022 to RMB327 million in first quarter of 2023.
Recent Developments
Update on Share Repurchase Program
During the fiscal year of 2022, the Company’s board of directors authorized two share repurchase programs on March 16, 2022 and on November 17, 2022, respectively, under which the Company could purchase up to an aggregate of US$70 million of its shares/ADSs over the next twelve months. Up to date, the Company has repurchased approximately 22 million ADSs for approximately US$48 million under these repurchase programs, in aggregate.
Outlook
Based on the Company’s preliminary assessment of the current market conditions, total loan originations for the second quarter of 2023 are expected to be around RMB63-63.5 billion, representing an increase of 28-29% on a year-over-year basis.
These estimates reflect the Company's current expectation, which is subject to change.
Conference Call
The Company’s management will host an earnings conference call at 10:00 PM U.S. Eastern time on May 23, 2023 (10:00 AM Beijing/Hong Kong time on May 24, 2023).
Participants who wish to join the conference call should register online at:
https://register.vevent.com/register/BI6a99701450344d7bbae49c8167f9ad17
Once registration is completed, each participant will receive the dial-in number and a unique access PIN for the conference call.
Participants joining the conference call should dial in at least 10 minutes before the scheduled start time.
A live and archived webcast of the conference call will also be available at the Company's investor relations website at http://ir.lexin.com.
About LexinFintech Holdings Ltd.
We are a leading credit technology-empowered personal financial service enabler. Our mission is to use technology and risk management expertise to make financing more accessible for young generation consumers. We strive to achieve this mission by connecting consumers with financial institutions, where we facilitate through a unique model that includes online and offline channels, installment consumption platform, big data and AI driven credit risk management capabilities, as well as smart user and loan management systems. We also empower financial institutions by providing cutting-edge proprietary technology solutions to meet their needs of financial digital transformation.
For more information, please visit http://ir.lexin.com.
To follow us on Twitter, please go to: https://twitter.com/LexinFintech.
Use of Non-GAAP Financial Measures Statement
In evaluating our business, we consider and use adjusted net income attributable to ordinary shareholders of the Company, non-GAAP EBIT, adjusted net income per ordinary share and per ADS attributable to ordinary shareholders of the Company, four non-GAAP measures, as supplemental measures to review and assess our operating performance. The presentation of the non-GAAP financial measures is not intended to be considered in isolation or as a substitute for the financial information prepared and presented in accordance with U.S. GAAP. We define adjusted net income attributable to ordinary shareholders of the Company as net income attributable to ordinary shareholders of the Company excluding share-based compensation expenses, interest expense associated with convertible notes, and investment income and we define non-GAAP EBIT as net income excluding income tax expense, share-based compensation expenses, interest expense, net, and investment income.
We present these non-GAAP financial measures because they are used by our management to evaluate our operating performance and formulate business plans. Adjusted net income attributable to ordinary shareholders of the Company enables our management to assess our operating results without considering the impact of share-based compensation expenses, interest expense associated with convertible notes, and investment loss. Non-GAAP EBIT, on the other hand, enables our management to assess our operating results without considering the impact of income tax expense, share-based compensation expenses, interest expense, net, and investment income. We also believe that the use of these non-GAAP financial measures facilitates investors’ assessment of our operating performance. These non-GAAP financial measures are not defined under U.S. GAAP and are not presented in accordance with U.S. GAAP.
These non-GAAP financial measures have limitations as an analytical tool. One of the key limitations of using adjusted net income attributable to ordinary shareholders of the Company and non-GAAP EBIT is that they do not reflect all items of income and expense that affect our operations. Share-based compensation expenses, interest expense associated with convertible notes, income tax expense, interest expense, net, and investment income have been and may continue to be incurred in our business and are not reflected in the presentation of adjusted net income attributable to ordinary shareholders of the Company and non-GAAP EBIT. Further, these non-GAAP financial measures may differ from the non-GAAP financial information used by other companies, including peer companies, and therefore their comparability may be limited.
We compensate for these limitations by reconciling each of the non-GAAP financial measures to the most directly comparable U.S. GAAP financial measure, which should be considered when evaluating our performance. We encourage you to review our financial information in its entirety and not rely on a single financial measure.
Exchange Rate Information Statement
This announcement contains translations of certain RMB amounts into U.S. dollars (“US$”) at specified rates solely for the convenience of the reader. Unless otherwise stated, all translations from RMB to US$ were made at the rate of RMB6.8676 to US$1.00, the exchange rate set forth in the H.10 statistical release of the Federal Reserve Board on March 31, 2023. The Company makes no representation that the RMB or US$ amounts referred could be converted into US$ or RMB, as the case may be, at any particular rate or at all.
Safe Harbor Statement
This announcement contains forward-looking statements. These statements are made under the “safe harbor” provisions of the U.S. Private Securities Litigation Reform Act of 1995. Statements that are not historical facts, including statements about Lexin’s beliefs and expectations, are forward-looking statements. These forward-looking statements can be identified by terminology such as “will,” expects,” “anticipates,” “future,” “intends,” “plans,” “believes,” “estimates,” “confident” and similar statements. Among other things, the expectation of its collection efficiency and delinquency, business outlook and quotations from management in this announcement, contain forward-looking statements. Lexin may also make written or oral forward-looking statements in its periodic reports to the U.S. Securities and Exchange Commission (the “SEC”), in its annual report to shareholders, in press releases and other written materials and in oral statements made by its officers, directors or employees to third parties. Forward-looking statements involve inherent risks and uncertainties. A number of factors could cause actual results to differ materially from those contained in any forward-looking statement, including but not limited to the following: Lexin’s goal and strategies; Lexin’s expansion plans; Lexin’s future business development, financial condition and results of operations; Lexin’s expectation regarding demand for, and market acceptance of, its credit and investment management products; Lexin’s expectations regarding keeping and strengthening its relationship with borrowers, institutional funding partners, merchandise suppliers and other parties it collaborates with; general economic and business conditions; and assumptions underlying or related to any of the foregoing. Further information regarding these and other risks is included in Lexin’s filings with the SEC. All information provided in this press release and in the attachments is as of the date of this press release, and Lexin does not undertake any obligation to update any forward-looking statement, except as required under applicable law.
For investor and media inquiries, please contact:
LexinFintech Holdings Ltd.
IR inquiries:
Jamie Wang
Tel: +86 (755) 3637-8888 ext. 6258
E-mail: jamiewang@lexin.com
Media inquiries:
Limin Chen
Tel: +86 (755) 3637-8888 ext. 6993
E-mail: liminchen@lexin.com
SOURCE LexinFintech Holdings Ltd.
| LexinFintech Holdings Ltd. | ||||||
| Unaudited Condensed Consolidated Balance Sheets | ||||||
| As of | ||||||
| (In thousands) | December 31, 2022 | March 31, 2023 | ||||
| RMB | RMB | US$ | ||||
| ASSETS | ||||||
| Current Assets | ||||||
| Cash and cash equivalents | 1,494,150 | 2,291,986 | 333,739 | |||
| Restricted cash | 1,267,512 | 2,606,968 | 379,604 | |||
| Restricted term deposit and short-term investments | 1,331,858 | 1,451,189 | 211,309 | |||
| Short-term financing receivables, net(1)(2) | 6,397,920 | 5,568,428 | 810,826 | |||
| Short-term contract assets and receivables, net(1)(2) | 3,894,175 | 4,186,986 | 609,672 | |||
| Deposits to insurance companies and guarantee companies | 2,249,022 | 2,209,563 | 321,737 | |||
| Prepayments and other current assets(2) | 1,086,952 | 1,119,663 | 163,035 | |||
| Amounts due from related parties | 6,602 | 6,455 | 940 | |||
| Inventories, net | 53,917 | 50,912 | 7,413 | |||
| Total Current Assets | 17,782,108 | 19,492,150 | 2,838,275 | |||
| Non-current Assets | ||||||
| Restricted cash | 168,521 | 157,974 | 23,003 | |||
| Long-term financing receivables, net(1) | 460,325 | 326,079 | 47,481 | |||
| Long-term contract assets and receivables, net(1)(2) | 605,051 | 749,417 | 109,124 | |||
| Property, equipment and software, net | 284,593 | 327,186 | 47,642 | |||
| Land use rights, net | 931,667 | 923,067 | 134,409 | |||
| Long-term investments | 348,376 | 348,639 | 50,766 | |||
| Deferred tax assets | 1,141,761 | 1,125,068 | 163,823 | |||
| Other assets | 1,048,301 | 1,147,876 | 167,144 | |||
| Total Non-current Assets | 4,988,595 | 5,105,306 | 743,392 | |||
| TOTAL ASSETS | 22,770,703 | 24,597,456 | 3,581,667 | |||
| LIABILITIES | ||||||
| Current liabilities | ||||||
| Accounts payable | 25,970 | 36,759 | 5,353 | |||
| Amounts due to related parties | 4,669 | 6,706 | 976 | |||
| Short-term borrowings | 1,168,046 | 1,453,320 | 211,620 | |||
| Short-term funding debts | 4,385,253 | 4,602,871 | 670,230 | |||
| Deferred guarantee income | 894,858 | 1,123,313 | 163,567 | |||
| Contingent guarantee liabilities | 882,107 | 1,093,151 | 159,175 | |||
| Accruals and other current liabilities(2) | 3,057,469 | 3,159,194 | 460,014 | |||
| Convertible notes | 2,063,545 | 1,759,669 | 256,228 | |||
| Total Current Liabilities | 12,481,917 | 13,234,983 | 1,927,163 | |||
| Non-current Liabilities | ||||||
| Long-term borrowings | 150,430 | 212,600 | 30,957 | |||
| Long-term funding debts | 1,334,105 | 1,882,549 | 274,120 | |||
| Deferred tax liabilities | 52,559 | 50,818 | 7,400 | |||
| Convertible notes | - | 110,030 | 16,022 | |||
| Other long-term liabilities | 102,941 | 92,714 | 13,500 | |||
| Total Non-current Liabilities | 1,640,035 | 2,348,711 | 341,999 | |||
| TOTAL LIABILITIES | 14,121,952 | 15,583,694 | 2,269,162 | |||
| Shareholders’ equity: | ||||||
| Class A Ordinary Shares | 191 | 192 | 29 | |||
| Class B Ordinary Shares | 47 | 47 | 8 | |||
| Treasury stock | (328,764 | ) | (328,764 | ) | (47,872 | ) |
| Additional paid-in capital | 3,081,254 | 3,114,777 | 453,547 | |||
| Statutory reserves | 1,022,592 | 1,022,592 | 148,900 | |||
| Accumulated other comprehensive income | (20,842 | ) | (16,845 | ) | (2,453 | ) |
| Retained earnings | 4,894,273 | 5,221,763 | 760,346 | |||
| Total shareholders’ equity | 8,648,751 | 9,013,762 | 1,312,505 | |||
| TOTAL LIABILITIES AND SHAREHOLDERS’ EQUITY | 22,770,703 | 24,597,456 | 3,581,667 | |||
| __________________________ | |
| (1) | Short-term financing receivables, net of allowance for credit losses of RMB184,187 and RMB131,160 as of December 31, 2022 and March 31, 2023, respectively. |
| Short-term contract assets and receivables, net of allowance for credit losses of RMB216,850 and RMB257,244 as of December 31, 2022 and March 31, 2023, respectively. | |
| Long-term financing receivables, net of allowance for credit losses of RMB13,220 and RMB7,730 as of December 31, 2022 and March 31, 2023, respectively. | |
| Long-term contract assets and receivables, net of allowance for credit losses of RMB52,742 and RMB67,977 as of December 31, 2022 and March 31, 2023, respectively. | |
| (2) | Starting from the fourth quarter of 2022, we updated the presentation of our Condensed Consolidated Balance Sheets, to provide more relevant and clear information. We also revised the presentation in comparative periods to conform to the current classification. |
| Accrued interest receivable is included in Short-term financing receivables. | |
| Guarantee receivables and Contract assets and service fees receivable are combined as Contract assets and receivables. | |
| Prepaid expenses and other current assets and Loan at fair value are combined as Prepayments and other current assets. | |
| Accrued interest payable and Accrued expenses and other current liabilities are combined as Accruals and other current liabilities. | |
| LexinFintech Holdings Ltd. | ||||||
| Unaudited Condensed Consolidated Statements of Operations | ||||||
| For the Three Months Ended March 31, | ||||||
| (In thousands, except for share and per share data) | 2022 | 2023 | ||||
| RMB | RMB | US$ | ||||
| Operating revenue: | ||||||
| Credit facilitation service income(3) | 896,425 | 2,115,808 | 308,085 | |||
| Loan facilitation and servicing fees-credit oriented | 255,739 | 964,171 | 140,394 | |||
| Guarantee income | 253,912 | 553,668 | 80,620 | |||
| Financing income(3) | 386,774 | 597,969 | 87,071 | |||
| Tech-empowerment service income(3) | 497,281 | 367,932 | 53,575 | |||
| Installment e-commerce platform service income(3) | 318,672 | 499,159 | 72,683 | |||
| Total operating revenue | 1,712,378 | 2,982,899 | 434,343 | |||
| Operating cost | ||||||
| Cost of sales | (328,213 | ) | (466,471 | ) | (67,923 | ) |
| Funding cost | (94,253 | ) | (150,383 | ) | (21,897 | ) |
| Processing and servicing cost | (462,465 | ) | (528,961 | ) | (77,023 | ) |
| Provision for financing receivables | (45,529 | ) | (138,848 | ) | (20,218 | ) |
| Provision for contract assets and receivables | (71,201 | ) | (141,946 | ) | (20,669 | ) |
| Provision for contingent guarantee liabilities | (249,892 | ) | (653,077 | ) | (95,095 | ) |
| Total operating cost | (1,251,553 | ) | (2,079,686 | ) | (302,825 | ) |
| Gross profit | 460,825 | 903,213 | 131,518 | |||
| Operating expenses: | ||||||
| Sales and marketing expenses | (360,444 | ) | (439,965 | ) | (64,064 | ) |
| Research and development expenses | (152,506 | ) | (129,527 | ) | (18,861 | ) |
| General and administrative expenses | (116,997 | ) | (97,037 | ) | (14,130 | ) |
| Total operating expenses | (629,947 | ) | (666,529 | ) | (97,055 | ) |
| Change in fair value of financial guarantee derivatives and loans at fair value | 262,868 | 156,265 | 22,754 | |||
| Interest expense, net | (15,305 | ) | (4,080 | ) | (594 | ) |
| Investment income | 1,374 | 160 | 23 | |||
| Others, net | 21,045 | 12,755 | 1,857 | |||
| Income before income tax expense | 100,860 | 401,784 | 58,503 | |||
| Income tax expense | (19,377 | ) | (74,294 | ) | (10,818 | ) |
| Net income | 81,483 | 327,490 | 47,685 | |||
| Less: net income attributable to non-controlling interests | 3,384 | - | - | |||
| Net income attributable to ordinary shareholders of the Company | 78,099 | 327,490 | 47,685 | |||
| Net income per ordinary share attributable to ordinary shareholders of the Company | ||||||
| Basic | 0.21 | 1.00 | 0.15 | |||
| Diluted | 0.21 | 0.92 | 0.13 | |||
| Net income per ADS attributable to ordinary shareholders of the Company | ||||||
| Basic | 0.42 | 2.00 | 0.29 | |||
| Diluted | 0.42 | 1.83 | 0.27 | |||
| Weighted average ordinary shares outstanding | ||||||
| Basic | 370,068,984 | 327,538,233 | 327,538,233 | |||
| Diluted | 372,075,542 | 374,265,630 | 374,265,630 | |||
| __________________________ | |
| (3) | Starting from the fourth quarter of 2022, we updated the descriptions of three categories of our revenue streams as Credit facilitation service income, Tech-empowerment service income, and Installment e-commerce platform service income, to provide more relevant and clear information. We also revised the revenue presentation in comparative periods to conform to the current classification. |
| Credit facilitation service income was previously reported as “Credit-Driven Platform Services” before the change of presentation. | |
| Financing income was previously reported as “Interest and financial services income and other revenues” before the change of presentation. | |
| Tech-empowerment service income was previously reported as “Technology-Driven Platform Services” before the change of presentation. | |
| Installment e-commerce platform service income was previously reported as “New consumption-driven, location-based services” before the change of presentation. | |
| LexinFintech Holdings Ltd. | ||||||
| Unaudited Condensed Consolidated Statements of Comprehensive Income | ||||||
| For the Three Months Ended March 31, | ||||||
| (In thousands) | 2022 | 2023 | ||||
| RMB | RMB | US$ | ||||
| Net income | 81,483 | 327,490 | 47,685 | |||
| Other comprehensive income | ||||||
| Foreign currency translation adjustment, net of nil tax | 1,008 | 3,997 | 582 | |||
| Total comprehensive income | 82,491 | 331,487 | 48,267 | |||
| Less: net income attributable to non-controlling interests | 3,384 | - | - | |||
| Total comprehensive income attributable to ordinary shareholders of the Company | 79,107 | 331,487 | 48,267 | |||
| LexinFintech Holdings Ltd. | ||||||
| Unaudited Reconciliations of GAAP and Non-GAAP Results | ||||||
| For the Three Months Ended March 31, | ||||||
| (In thousands, except for share and per share data) | 2022 | 2023 | ||||
| RMB | RMB | US$ | ||||
| Reconciliation of Adjusted net income attributable to ordinary shareholders of the Company to Net income attributable to ordinary shareholders of the Company | ||||||
| Net income attributable to ordinary shareholders of the Company | 78,099 | 327,490 | 47,685 | |||
| Add: Share-based compensation expenses | 41,568 | 32,669 | 4,757 | |||
| Interest expense associated with convertible notes | 10,939 | 15,056 | 2,192 | |||
| Investment income | (1,374 | ) | (160 | ) | (23 | ) |
| Adjusted net income attributable to ordinary shareholders of the Company | 129,232 | 375,055 | 54,611 | |||
| Adjusted net income per ordinary share attributable to ordinary shareholders of the Company | ||||||
| Basic | 0.35 | 1.15 | 0.17 | |||
| Diluted | 0.31 | 1.00 | 0.15 | |||
| Adjusted net income per ADS attributable to ordinary shareholders of the Company | ||||||
| Basic | 0.70 | 2.29 | 0.33 | |||
| Diluted | 0.62 | 2.00 | 0.29 | |||
| Weighted average number of ordinary shares outstanding attributable to ordinary shareholders of the Company | ||||||
| Basic | 370,068,984 | 327,538,233 | 327,538,233 | |||
| Diluted | 414,932,685 | 374,265,630 | 374,265,630 | |||
| Reconciliations of Non-GAAP EBIT to Net income | ||||||
| Net income | 81,483 | 327,490 | 47,685 | |||
| Add: Income tax expense | 19,377 | 74,294 | 10,818 | |||
| Share-based compensation expenses | 41,568 | 32,669 | 4,757 | |||
| Interest expense, net | 15,305 | 4,080 | 594 | |||
| Investment income | (1,374 | ) | (160 | ) | (23 | ) |
| Non-GAAP EBIT | 156,359 | 438,373 | 63,831 | |||
Additional Credit Information
Vintage Charge Off Curve
Dpd30+/GMV by Performance Windows
First Payment Default 30+

![]()
Vintage Charge Off Curve
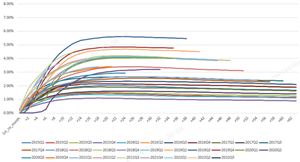
Vintage Charge Off Curve
Dpd30+/GMV by Performance Windows
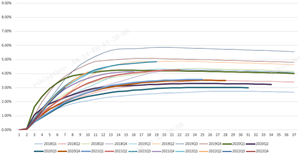
Dpd30+/GMV by Performance Windows
First Payment Default 30+
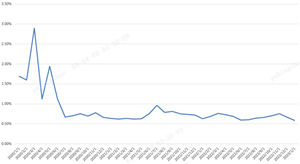
First Payment Default 30+
Legal Disclaimer:
EIN Presswire provides this news content "as is" without warranty of any kind. We do not accept any responsibility or liability for the accuracy, content, images, videos, licenses, completeness, legality, or reliability of the information contained in this article. If you have any complaints or copyright issues related to this article, kindly contact the author above.
