
Jiayin Group Inc. Reports Fourth Quarter and Fiscal Year 2022 Unaudited Financial Results
-- Fourth Quarter Total Loan Origination Volume Grew 249.2% to RMB18.9 billion --
-- Fourth Quarter Net Income Grew 335.7% to RMB533.7 million --
-- Full Year Revenue Grew 83.7% to RMB3,271.4 million --
-- Full Year Net Income Grew 152.3% to RMB1,180.2 million --
SHANGHAI, China, March 29, 2023 (GLOBE NEWSWIRE) -- Jiayin Group Inc. (“Jiayin” or the “Company”) (NASDAQ: JFIN), a leading fintech platform in China, today announced its unaudited financial results for the fourth quarter and fiscal year ended December 31, 2022.
Fourth Quarter 2022 Operational and Financial Highlights:
- Loan origination volume1 was RMB18.9 billion (US$2.7 billion), representing an increase of 249.2% from the same period of 2021.
- Average borrowing amount per borrowing was RMB10,884 (US$1,578), representing an increase of 51.0% from the same period of 2021.
- Repeat borrowing rate2 was 67.2%, compared with 66.9% in the same period of 2021.
- Net revenue was RMB1,054.4 million (US$152.9 million), representing an increase of 186.4% from the same period of 2021.
- Income from operations was RMB346.5 million (US$50.2 million), compared with RMB14.7 million in the same period of 2021.
- Net income was RMB533.7 million (US$77.4 million), representing an increase of 335.7% from RMB122.5 million in the same period of 2021.
Full Year 2022 Operational and Financial Highlights:
- Loan origination volume1 was RMB55.5 billion (US$8.0 billion), representing an increase of 153.4% from RMB21.9 billion in 2021.
- Average borrowing amount per borrowing was RMB9,821 (US$1,424), representing an increase of 52.7% from RMB6,430 in 2021.
- Repeat borrowing rate2 was 67.0%, compared with 70.5% in 2021.
- Net revenue was RMB3,271.4 million (US$474.3 million), representing an increase of 83.7% from RMB1,780.5 million in 2021.
- Income from operations was RMB1,182.0 million (US$171.4 million), compared with RMB432.0 million in 2021.
- Net income was RMB1,180.2 million (US$171.1 million), compared with RMB467.8 million in 2021.
Mr. Yan Dinggui, the Company’s Founder, Director and Chief Executive Officer, commented: “Despite the COVID-induced challenges throughout 2022, our focus on technology innovation and partnership network expansion paid off, leading to a record-breaking growth in 2022. Our loan origination volume grew by 153.4% in 2022 and 249.2% in the fourth quarter year over year (“yoy”), while our net income surged by 152.3% in 2022 and 335.7% in the fourth quarter yoy. This exceptional growth demonstrates our commitment to expanding funding sources, improving asset quality, enhancing risk management capabilities, and fine-tuning our operations. Going forward, we will remain resolute in our pursuit of sustainable growth and margin expansion. As the regulatory environment stabilizes in 2023 and the COVID pandemic becomes a thing of the past, we are confident that our proven strategies will continue to drive our success in the years to come.”
Fourth Quarter 2022 Financial Results
Net revenue was RMB1,054.4 million (US$152.9 million), representing an increase of 186.4% from the same period of 2021.
Revenue from loan facilitation services was RMB899.7 million (US$130.4 million), representing an increase of 149.2% from the same period of 2021. The increase was primarily due to increased loan origination volume from the Company’s institutional funding partners.
Other revenue was RMB154.7 million (US$22.4 million), compared with RMB7.1 million in the fourth quarter of 2021. The increase was mainly driven by higher revenues generated from individual investor referral services as well as an increase in post-facilitation service revenues from financial guarantee services.
Origination and servicing expense was RMB195.1 million (US$28.3 million), representing an increase of 130.1% from the same period of 2021, driven by the increase in the Company’s loan origination volume as well as higher expenses related to the increase in post-facilitation service revenues from financial guarantee services.
Allowance for uncollectible receivables, contract assets, loans receivable and others was RMB15.1 million (US$2.2 million), representing a decrease of 12.2% from the same period of 2021.
Sales and marketing expense was RMB374.0 million (US$54.2 million), representing an increase of 138.4% from the same period of 2021, primarily due to increases of borrower acquisition expenses.
General and administrative expense was RMB59.3 million (US$8.6 million), representing an increase of 26.7% from the same period of 2021, primarily driven by an increase in expenditures for employee related benefits.
Research and development expense was RMB64.4 million (US$9.3 million), representing an increase of 38.2% from the same period of 2021, primarily due to higher employee compensation benefit expenses as well as increased professional service fees.
Income from operations was RMB346.5 million (US$50.2 million), compared with RMB14.7 million in the same period of 2021.
Gain from de-recognition of other payable associated with disposal of Shanghai Caiyin was RMB117.0 million (US$17.0 million), compared with RMB138.0 million in the same period of 2021. The gain was derived from the release of a contingent consideration payable.
Net income was RMB533.7 million (US$77.4 million), representing an increase of 335.7% from RMB122.5 million in the same period of 2021.
Basic and diluted net income per share was RMB2.49 (US$0.36), compared to RMB0.57 in the fourth quarter of 2021. Basic and diluted net income per ADS was RMB9.97 (US$1.45), compared to RMB2.29 in the fourth quarter of 2021. Each ADS represents four Class A ordinary shares of the Company.
Cash and cash equivalents were RMB291.0 million (US$42.2 million) as of December 31, 2022, compared with RMB217.5 million as of September 30, 2022.
Full Year 2022 Financial Results
Net revenue was RMB3,271.4 million (US$474.3 million), representing an increase of 83.7% from RMB1,780.5 million in 2021.
Revenue from loan facilitation services was RMB2,881.7 million (US$417.8 million), representing an increase of 74.8% from 2021. The increase was primarily due to increased loan origination volume from the Company’s institutional funding partners.
Other revenue was RMB389.7 million (US$56.5 million), representing an increase of 195.7% from 2021. The increase was mainly driven by revenue generated from individual investor referral services.
Origination and servicing expense was RMB565.2 million (US$81.9 million), representing an increase of 76.3% from 2021, driven by the increase in the Company’s loan origination volume.
Allowance for uncollectible receivables, contract assets, loans receivable and others was RMB32.1 million (US$4.7 million), representing a decrease of 27.7% from 2021, primarily due to increased loan lending volume from the Company’s overseas business resulting in higher asset impairment allowance.
Sales and marketing expense was RMB1,081.4 million (US$156.8 million), representing an increase of 64.0% from 2021, primarily due to an increase in borrower acquisition expenses in 2022.
General and administrative expense was RMB194.0 million (US$28.1 million), representing an increase of 17.4% from 2021, primarily driven by increases in employee related benefit expenses.
Research and development expense was RMB216.7 million (US$31.4 million), representing an increase of 50.8% from 2021, primarily due to higher employee compensation and benefit expenses as well as increased professional service fees.
Income from operations was RMB1,182.0 million (US$171.4 million), representing an increase of 173.6% from RMB432.0 million in 2021.
Gain from de-recognition of other payable associated with disposal of Shanghai Caiyin was RMB117.0 million (US$17.0 million), compared with RMB138.0 million in 2021. The gain was derived from the release of a contingent consideration payable in the fourth quarter of 2022.
Net income was RMB1,180.2 million (US$171.1 million), representing an increase of 152.3% from RMB467.8 million in 2021.
Basic and diluted net income per share was RMB5.48 (US$0.79), compared to RMB2.18 in 2021. Basic and diluted net income per ADS was RMB21.92 (US$3.18), compared to RMB8.74 in 2021. Each ADS represents four Class A ordinary shares of the Company.
The financial statements for the fourth quarter and full year ended December 31, 2022 herein the press release have not been audited by the Company’s independent registered accounting firm. The audited financial statements for the year ended December 31, 2022 to be disclosed in the Company’s Form 20-F may have discrepancies with the above-mentioned unaudited financial statements.
The following table provides the delinquency rates of all outstanding loans on the Company’s platform in Mainland China as of the respective dates indicated.
| Delinquent for | ||||||
| As of | 1-30 days | 31-60 days | 61-90 days | 91 -180 days | More than 180 days | |
| (%) | ||||||
| December 31, 2018 | 1.35 | 2.53 | 2.37 | 5.46 | 9.45 | |
| December 31, 2019 | 1.27 | 2.20 | 1.68 | 4.79 | 8.39 | |
| December 31, 2020 | 1.47 | 0.88 | 0.70 | 1.66 | 1.81 | |
| December 31, 2021 | 1.31 | 0.90 | 0.72 | 1.78 | 2.12 | |
| March 31, 2022 | 0.78 | 0.74 | 0.53 | 1.61 | 2.69 | |
| June 30, 2022 | 0.89 | 0.50 | 0.44 | 1.00 | 2.61 | |
| September 30, 2022 | 0.99 | 0.62 | 0.46 | 0.96 | 2.42 | |
| December 31, 2022 | 1.01 | 0.67 | 0.51 | 1.18 | 2.02 | |
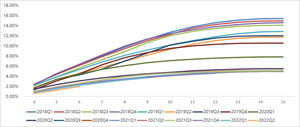
The following chart and table display the historical cumulative M3+ Delinquency Rate by Vintage for loan products facilitated through the Company’s platform in Mainland China.
| Month on Book | ||||||||||||||||||||||||
| Vintage | 4th | 5th | 6th | 7th | 8th | 9th | 10th | 11th | 12th | 13th | 14th | 15th | ||||||||||||
| 2018Q1 | 2.41 | % | 4.38 | % | 6.21 | % | 8.05 | % | 9.80 | % | 11.35 | % | 12.71 | % | 13.80 | % | 14.61 | % | 15.10 | % | 15.38 | % | 15.44 | % |
| 2018Q2 | 2.43 | % | 4.43 | % | 6.15 | % | 7.87 | % | 9.47 | % | 11.02 | % | 12.30 | % | 13.50 | % | 14.25 | % | 14.70 | % | 14.94 | % | 15.00 | % |
| 2018Q3 | 2.23 | % | 3.89 | % | 5.66 | % | 7.30 | % | 8.89 | % | 10.64 | % | 12.00 | % | 12.86 | % | 13.47 | % | 13.87 | % | 14.07 | % | 14.13 | % |
| 2018Q4 | 2.26 | % | 4.53 | % | 6.38 | % | 8.25 | % | 9.99 | % | 11.40 | % | 12.44 | % | 13.22 | % | 13.83 | % | 14.25 | % | 14.53 | % | 14.64 | % |
| 2019Q1 | 2.17 | % | 3.86 | % | 5.32 | % | 6.84 | % | 8.13 | % | 9.21 | % | 10.21 | % | 11.07 | % | 11.85 | % | 12.45 | % | 12.80 | % | 12.87 | % |
| 2019Q2 | 1.83 | % | 3.40 | % | 4.59 | % | 5.85 | % | 6.98 | % | 8.21 | % | 9.35 | % | 10.33 | % | 11.08 | % | 11.54 | % | 11.73 | % | 11.74 | % |
| 2019Q3 | 1.64 | % | 3.41 | % | 4.26 | % | 5.42 | % | 7.03 | % | 8.60 | % | 10.13 | % | 10.94 | % | 11.59 | % | 11.92 | % | 12.04 | % | 12.01 | % |
| 2019Q4 | 1.31 | % | 3.08 | % | 4.52 | % | 6.27 | % | 7.69 | % | 8.69 | % | 9.51 | % | 9.99 | % | 10.31 | % | 10.49 | % | 10.55 | % | 10.54 | % |
| 2020Q1 | 1.67 | % | 3.43 | % | 4.46 | % | 5.36 | % | 6.11 | % | 6.67 | % | 7.09 | % | 7.38 | % | 7.61 | % | 7.76 | % | 7.84 | % | 7.85 | % |
| 2020Q2 | 1.46 | % | 2.37 | % | 3.11 | % | 3.68 | % | 4.14 | % | 4.52 | % | 4.80 | % | 5.08 | % | 5.27 | % | 5.42 | % | 5.49 | % | 5.51 | % |
| 2020Q3 | 0.96 | % | 1.70 | % | 2.24 | % | 2.77 | % | 3.27 | % | 3.73 | % | 4.16 | % | 4.47 | % | 4.71 | % | 4.87 | % | 4.96 | % | 4.98 | % |
| 2020Q4 | 0.85 | % | 1.74 | % | 2.37 | % | 3.00 | % | 3.49 | % | 3.89 | % | 4.24 | % | 4.50 | % | 4.72 | % | 4.87 | % | 4.96 | % | 4.99 | % |
| 2021Q1 | 0.96 | % | 1.83 | % | 2.45 | % | 3.04 | % | 3.51 | % | 3.95 | % | 4.28 | % | 4.56 | % | 4.78 | % | 4.93 | % | 5.01 | % | 5.03 | % |
| 2021Q2 | 1.00 | % | 1.90 | % | 2.65 | % | 3.30 | % | 3.90 | % | 4.35 | % | 4.64 | % | 4.89 | % | 5.01 | % | 5.10 | % | 5.14 | % | 5.15 | % |
| 2021Q3 | 0.95 | % | 1.86 | % | 2.65 | % | 3.31 | % | 3.94 | % | 4.33 | % | 4.60 | % | 4.79 | % | 4.93 | % | 5.02 | % | 5.08 | % | 5.10 | % |
| 2021Q4 | 0.84 | % | 1.78 | % | 2.43 | % | 2.97 | % | 3.40 | % | 3.77 | % | 4.12 | % | 4.39 | % | 4.61 | % | — | — | — | |||
| 2022Q1 | 0.74 | % | 1.54 | % | 2.21 | % | 2.77 | % | 3.26 | % | 3.69 | % | — | — | — | — | — | — | ||||||
| 2022Q2 | 0.59 | % | 1.30 | % | 1.94 | % | — | — | — | — | — | — | — | — | — | |||||||||
Business Outlook
The Company expects its loan facilitation volume for the full year of 2023 to be around RMB70 billion and its loan facilitation volume for the first quarter of 2023 to be around RMB19 billion. This forecast reflects the Company’s current and preliminary views on the market and operational conditions, which are subject to change.
Recent Development
Dividend Policy
On March 28, 2023, the Company’s board of directors (the “Board”) approved and adopted a dividend policy, under which the Company may choose to declare and distribute cash dividend twice each fiscal year, starting from 2023, at an aggregate amount of no less than 15% of the net income after tax of the Company in the previous fiscal year. The determination to make dividend distributions in any particular fiscal year will be made at the discretion of the Board based upon factors such as the Company’s results of operations, cash flow, general financial condition, capital requirements, contractual restrictions and other factors as the Board may deem relevant.
Share Repurchase Plan Update
On June 13, 2022, the Board authorized a share repurchase plan under which the Company may repurchase its ordinary shares with an aggregate value of US$10 million during the 12-month period beginning on June 13, 2022. As of December 31, 2022, the Company had repurchased approximately 1.5 million of its American depositary shares for approximately US$3.5 million under this share repurchase plan.
Conference Call
The Company will conduct a conference call to discuss its financial results on Wednesday, March 29, 2023 at 8:00 AM U.S. Eastern Time (8:00 PM Beijing/Hong Kong Time on the same day).
To join the conference call, all participants must use the following link to complete the online registration process in advance. Upon registering, each participant will receive access details for this event including the dial-in numbers, a PIN number, and an e-mail with detailed instructions to join the conference call.
Participant Online Registration:
https://register.vevent.com/register/BIbd208781a2e546b08417d88e64b9856f
A live and archived webcast of the conference call will be available on the Company’s investors relations website at http://ir.jiayin-fintech.com/.
About Jiayin Group Inc.
Jiayin Group Inc. is a leading fintech platform in China committed to facilitating effective, transparent, secure and fast connections between underserved individual borrowers and financial institutions. The origin of the business of the Company can be traced back to 2011. The Company operates a highly secure and open platform with a comprehensive risk management system and a proprietary and effective risk assessment model which employs advanced big data analytics and sophisticated algorithms to accurately assess the risk profiles of potential borrowers. For more information, please visit https://ir.jiayin-fintech.com/.
Exchange Rate Information
This announcement contains translations of certain RMB amounts into U.S. dollars (“US$”) at a specified rates solely for the convenience of the reader. Unless otherwise noted, all translations from RMB to U.S. dollars are made at a rate of RMB6.8972 to US$1.00, the exchange rate set forth in the H.10 statistical release of the Board of Governors of the Federal Reserve System as of December 30, 2022. The Company makes no representation that the RMB or US$ amounts referred could be converted into US$ or RMB, as the case may be, at any particular rate or at all.
Safe Harbor / Forward-Looking Statements
This announcement contains forward-looking statements. These statements are made under the “safe harbor” provisions of the United States Private Securities Litigation Reform Act of 1995. These forward-looking statements can be identified by terminology such as “will,” “expects,” “anticipates,” “future,” “intends,” “plans,” “believes,” “estimates” and similar statements. The Company may also make written or oral forward-looking statements in its periodic reports to the SEC, in its annual report to shareholders, in press releases and other written materials and in oral statements made by its officers, directors or employees to third parties. Statements that are not historical facts, including statements about the Company’s beliefs and expectations, are forward-looking statements. Forward-looking statements involve inherent risks and uncertainties and are based on current expectations, assumptions, estimates and projections about the Company and the industry. Potential risks and uncertainties include, but are not limited to, those relating to the Company’s ability to retain existing investors and borrowers and attract new investors and borrowers in an effective and cost-efficient way, the Company’s ability to increase the investment volume and loan origination of loans volume facilitated through its marketplace, effectiveness of the Company’s credit assessment model and risk management system, PRC laws and regulations relating to the online individual finance industry in China, general economic conditions in China, and the Company’s ability to meet the standards necessary to maintain listing of its ADSs on the Nasdaq Stock Market or other stock exchange, including its ability to cure any non-compliance with the continued listing criteria of the Nasdaq Stock Market. All information provided in this press release is as of the date hereof, and the Company undertakes no obligation to update any forward-looking statements to reflect subsequent occurring events or circumstances, or changes in its expectations, except as may be required by law. Although the Company believes that the expectations expressed in these forward-looking statements are reasonable, it cannot assure you that its expectations will turn out to be correct, and investors are cautioned that actual results may differ materially from the anticipated results. Further information regarding risks and uncertainties faced by the Company is included in the Company’s filings with the U.S. Securities and Exchange Commission, including its annual report on Form 20-F.
For investor and media inquiries, please contact:
Jiayin Group
Mr. Shawn Zhang
Email: ir@jiayinfintech.cn
or
The Blueshirt Group
Ms. Ally Wang
Email: ally@blueshirtgroup.com
| JIAYIN GROUP INC. UNAUDITED CONDENSED CONSOLIDATED BALANCE SHEETS (Amounts in thousands, except for share and per share data) | ||||||||
|
As of December 31, |
As of December 31, |
|||||||
| 2021 | 2022 | |||||||
| RMB | RMB | US$ | ||||||
| ASSETS | ||||||||
| Cash and cash equivalents | 182,551 | 291,018 | 42,194 | |||||
| Restricted cash | 2,016 | 2,023 | 293 | |||||
| Amounts due from related parties | 37,017 | 17,750 | 2,574 | |||||
| Accounts receivable and contract assets, net | 502,431 | 1,732,218 | 251,148 | |||||
| Financial assets receivables | - | 292,342 | 42,386 | |||||
| Loan receivables, net | 329 | 3,151 | 457 | |||||
| Prepaid expenses and other current assets | 62,255 | 472,830 | 68,554 | |||||
| Deferred tax assets, net | 48,456 | 70,778 | 10,262 | |||||
| Property and equipment, net | 9,100 | 18,900 | 2,740 | |||||
| Right-of-use assets | 35,507 | 27,604 | 4,002 | |||||
| Long-term investment | 90,528 | 90,497 | 13,121 | |||||
| Other non-current assets | 1,242 | 1,759 | 255 | |||||
| TOTAL ASSETS | 971,432 | 3,020,870 | 437,986 | |||||
| LIABILITIES AND EQUITY | ||||||||
| Deferred guarantee income | - | 276,518 | 40,091 | |||||
| Payroll and welfare payable | 56,056 | 81,558 | 11,825 | |||||
| Amounts due to related parties | 4,485 | 566 | 82 | |||||
| Tax payables | 409,063 | 632,825 | 91,751 | |||||
| Accrued expenses and other current liabilities | 118,808 | 572,135 | 82,953 | |||||
| Other payable related to the disposal of Shanghai Caiyin | 322,028 | 188,300 | 27,301 | |||||
| Lease liabilities | 35,243 | 27,465 | 3,982 | |||||
| TOTAL LIABILITIES | 945,683 | 1,779,367 | 257,985 | |||||
| SHAREHOLDERS' EQUITY | ||||||||
| Class A ordinary shares (US$ 0.000000005 par value; 108,100,000 shares issued as of December 31, 2021 and December 31, 2022; 108,100,000 and 105,727,404 shares outstanding as of December 31, 2021 and December 31, 2022)3 |
- | - | - | |||||
| Class B ordinary shares (US$ 0.000000005 par value; 108,000,000 shares issued and outstanding as of December 31, 2021 and December 31, 2022)3 |
- | - | - | |||||
| Additional paid-in capital | 840,580 | 870,562 | 126,220 | |||||
| Treasury stock (nil and 2,372,596 shares as of December 31, 2021 and December 31, 2022, respectively) |
- | (9,262 | ) | (1,343 | ) | |||
| (Accumulated deficit) Retained earnings | (794,762 | ) | 384,896 | 55,805 | ||||
| Accumulated other comprehensive loss | (17,954 | ) | (3,112 | ) | (452 | ) | ||
| Total Jiayin Group Inc. shareholder's equity | 27,864 | 1,243,084 | 180,230 | |||||
| Non-controlling interests | (2,115 | ) | (1,581 | ) | (229 | ) | ||
| TOTAL SHAREHOLDERS' EQUITY | 25,749 | 1,241,503 | 180,001 | |||||
| TOTAL LIABILITIES AND EQUITY | 971,432 | 3,020,870 | 437,986 | |||||
| JIAYIN GROUP INC. UNAUDITED CONDENSED CONSOLIDATED STATEMENTS OF COMPREHENSIVE INCOME (Amounts in thousands, except for share and per share data) | |||||||||||||||||||
|
For the Three Months Ended December 31, |
For the Year Ended December 31, |
||||||||||||||||||
| 2021 | 2022 | 2021 | 2022 | ||||||||||||||||
| RMB | RMB | US$ | RMB | RMB | US$ | ||||||||||||||
|
Net revenue (including revenue from related parties of RMB804, RMB694 for 2021Q4, 2022Q4, RMB34,619, and RMB6,567 for 2021 and 2022, respectively) |
368,212 | 1,054,392 | 152,872 | 1,780,490 | 3,271,414 | 474,310 | |||||||||||||
| Operating costs and expenses: | |||||||||||||||||||
| Origination and servicing | (84,841 | ) | (195,098 | ) | (28,287 | ) | (320,466 | ) | (565,227 | ) | (81,950 | ) | |||||||
| Cost of sales | (1,078 | ) | - | - | (15,467 | ) | - | - | |||||||||||
| Allowance for uncollectible receivables, contract assets, loans receivable and others |
(17,186 | ) | (15,073 | ) | (2,185 | ) | (44,427 | ) | (32,053 | ) | (4,647 | ) | |||||||
| Sales and marketing | (156,949 | ) | (373,971 | ) | (54,221 | ) | (659,291 | ) | (1,081,382 | ) | (156,786 | ) | |||||||
| General and administrative | (46,841 | ) | (59,320 | ) | (8,601 | ) | (165,150 | ) | (194,039 | ) | (28,133 | ) | |||||||
| Research and development | (46,586 | ) | (64,442 | ) | (9,342 | ) | (143,733 | ) | (216,694 | ) | (31,418 | ) | |||||||
| Total operating costs and expenses | (353,481 | ) | (707,904 | ) | (102,636 | ) | (1,348,534 | ) | (2,089,395 | ) | (302,934 | ) | |||||||
| Income from operation | 14,731 | 346,488 | 50,236 | 431,956 | 1,182,019 | 171,376 | |||||||||||||
| Gain from de-recognition of other payable associated with disposal of Shanghai Caiyin |
138,043 | 117,021 | 16,966 | 138,043 | 117,021 | 16,966 | |||||||||||||
| Impairment of long-term investment | - | (15,078 | ) | (2,186 | ) | - | (15,078 | ) | (2,186 | ) | |||||||||
| Interest (expense), net | (685 | ) | (943 | ) | (137 | ) | (1,117 | ) | 281 | 42 | |||||||||
| Other income, net | 1,425 | 36,325 | 5,267 | 16,952 | 43,447 | 6,299 | |||||||||||||
|
Income before income taxes and income from investment in affiliates |
153,514 | 483,813 | 70,146 | 585,834 | 1,327,690 | 192,497 | |||||||||||||
| Income tax (expense) credit | (36,037 | ) | 49,994 | 7,248 | (125,724 | ) | (155,398 | ) | (22,531 | ) | |||||||||
| Income (loss) from investment in affiliates |
5,014 | (109 | ) | (15 | ) | 7,651 | 7,940 | 1,152 | |||||||||||
| Net income | 122,491 | 533,698 | 77,379 | 467,761 | 1,180,232 | 171,118 | |||||||||||||
| Less: net (loss) income attributable to noncontrolling interest shareholders |
(1,189 | ) | 761 | 110 | (4,325 | ) | 574 | 84 | |||||||||||
|
Net income attributable to Jiayin Group Inc. |
123,680 | 532,937 | 77,269 | 472,086 | 1,179,658 | 171,034 | |||||||||||||
|
Weighted average shares used in calculating net income per share: |
|||||||||||||||||||
| - Basic and diluted | 216,100,000 | 213,789,483 | 213,789,483 | 216,100,000 | 215,259,640 | 215,259,640 | |||||||||||||
| Net income per share: | |||||||||||||||||||
| - Basic and diluted | 0.57 | 2.49 | 0.36 | 2.18 | 5.48 | 0.79 | |||||||||||||
| Net income per ADS: | |||||||||||||||||||
| - Basic and diluted | 2.29 | 9.97 | 1.45 | 8.74 | 21.92 | 3.18 | |||||||||||||
| Net income | 122,491 | 533,698 | 77,379 | 467,761 | 1,180,232 | 171,118 | |||||||||||||
|
Other comprehensive income, net of tax of nil: |
|||||||||||||||||||
| Foreign currency translation adjustments | (1,513 | ) | (4,181 | ) | (606 | ) | (5,229 | ) | 14,802 | 2,146 | |||||||||
| Comprehensive income | 120,978 | 529,517 | 76,773 | 462,532 | 1,195,034 | 173,264 | |||||||||||||
| Comprehensive (loss) income attributable to noncontrolling interest |
(1,158 | ) | 875 | 127 | (4,417 | ) | 534 | 78 | |||||||||||
|
Total comprehensive income attributable to Jiayin Group Inc. |
122,136 | 528,642 | 76,646 | 466,949 | 1,194,500 | 173,186 | |||||||||||||
___________________
1 “Loan origination volume” refers the loan origination volume facilitated in Mainland China during the period presented.
2 “Repeat borrowing rate” refers to the repeat borrowers as a percentage of all of our borrowers in Mainland China.
“Repeat borrowers” during a certain period refers to borrowers who have borrowed in such period and have borrowed at least twice since such borrowers’ registration on our platform until the end of such period.
3 The total shares authorized for both Class A and Class B are 10,000,000,000,000.
A chart accompanying this announcement is available at https://www.globenewswire.com/NewsRoom/AttachmentNg/6cfdbc64-9bde-43af-a310-5c3d1f67162d

![]()
M3+ Delinquency Rate by Vintage
M3+ Delinquency Rate by Vintage
