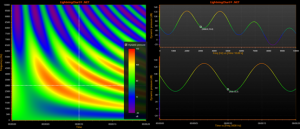
Visualizing Data With .NET Charts
KUOPIO, FINLAND, May 30, 2022 /EINPresswire.com/ -- What is .NET? .NET is an open-source platform for developing different types of applications. It's a popular, cross-platform and free option originally developed by Microsoft.
.NET for cross-platform application development is compatible with web servers and console applications. The .NET framework can support multiple services on Windows-native applications. (Xamarin implementation for running applications on different mobile OS.)
In terms of visualizing data, there are many charting libraries for .NET. They can be open-source and commercial, but the difference between them relies on key features that determine the end-user performance delivered in the .NET applications.
Here are some characteristics of high-performance charting controls:
GPU acceleration.
GPUs always make it so that the device is able to maximize the use of its resources and deliver faster visualizations. Some advantages that come with GPU acceleration are real-time monitoring applications, high-resolution visualizations, smooth interactivity without rendering delays or flickering, efficient device's resource-management (important for developers working with high-performance applications).
Fallback rendering.
High-performance charting libraries should be able to deliver content when GPU rendering is unavailable. For example, LightningChart .NET uses DirectX11/DirectX9 WARP software rendering as a fallback option.
Library collection & functionality.
Visualization libraries should provide a variety of 2D and 3D charts for use in any demanding industry. For visualizations, there are many different types of charts and diagrams.
.NET compatibility.
Any charting library can be used primarily to support .NET framework applications and additionally support other versions of .NET, including new releases like .NET 6.
UI features & interactivity.
Interactive visualizations help data-driven users understand their data, analyses and ultimately get new insights from it by giving them a visual way how to interact with the charts. Charting libraries often hold back performance while they are being interactive.
High performance data visualization allows for a good interactive experience. With that, data can be viewed and plotted in different ways, making it an even better format to show the true results of surveys and analyses.
The maximum amount of data visualized.
The amount of data that are chart can visualize varies depending on the type, the charting library language, and the device. For example, the maximum amount of data that can be visualized is 1 trillion data points using the DigitalLineSeries which is a chart of the type LineSeries.
Pasi Tuomainen
Arction Ltd.
+358 453150905
email us here
Visit us on social media:
Facebook
Twitter
LinkedIn

