
Hudbay Announces Updated Constancia and Snow Lake Mine Plans and Provides Annual Reserve and Resource Update
Global Increase to Copper and Gold Reserves
- Hudbay’s total mineral reserves increase by approximately 170,000 tonnes of contained copper and 360,000 ounces of contained gold compared to the prior year’s estimates after adjusting for mining depletion in 2020.
- New three-year production guidance issued; consolidated copper and gold production are expected to increase by 36% and 125%i, respectively, by 2023 from 2020 levels as Hudbay brings online its Pampacancha and New Britannia growth projects.
- Pampacancha and New Britannia growth projects are nearing completion with a total of approximately $80 million remaining to be spent in 2021.
- Hudbay’s two flagship producing assets, Constancia and the Snow Lake operations, each have a 17-year mine life (to 2037) based on current reserves.
Constancia Highlights
- Constancia reserves increase by 33 million tonnes at a grade of 0.48% copper and 0.115 grams per tonne gold, resulting in an increase of approximately 11% in contained copper and 12% in contained gold over the prior year’s reserves, after adjusting for mining depletion in 2020.
- Improved Constancia mine plan incorporating higher grades from Pampacancha from 2022 to 2025 and the new Constancia North reserves to extend the medium-term production profile.
- Average annual copper production at Constancia over the next eight years increases to approximately 102,000 tonnes at an average cash cost and sustaining cash cost of $1.18 and $1.71ii, respectively, per pound of copper produced net of by-product credits.
- Constancia’s total copper and gold production increases by 12% and 9%, respectively, compared to the same period in the previous mine planiii.
Snow Lake Highlights
- Snow Lake mineral reserves continue to increase year-over-year as successful resource-to-reserve conversion more than offsets mining depletion.
- Advanced phase three of Hudbay’s Snow Lake gold strategy through various mining and milling optimization opportunities.
- Improved Snow Lake mine plan contemplates an increase in Lalor’s mining rate to 5,300 tonnes per day in 2023, from a planned 4,500 tonnes per day previously, and the incorporation of the mining of the 1901 deposit by 2026.
- Annual gold production from Lalor and the Snow Lake operations increases to over 180,000 ounces during the first six years of New Britannia production at the lowest quartile cash cost globallyiv
- Snow Lake’s gold, copper and silver production increases by 18%, 35% and 27%, respectively, from 2022 to 2027 compared to the previous mine plan.
TORONTO, March 29, 2021 (GLOBE NEWSWIRE) -- Hudbay Minerals Inc. (“Hudbay” or the “company”) (TSX, NYSE: HBM) today announced that it has filed updated National Instrument 43-101 (“NI 43-101”) technical reports in respect of its 100% owned Constancia copper mine in Peru and its 100% owned Lalor and Snow Lake gold-zinc mining and milling operations in Manitoba. The company also released its annual mineral reserve and resource update and issued new three-year production guidance. All dollar amounts are in US dollars, unless otherwise noted.
“We are excited to publish these updated mine plans, which solidify our copper and gold production growth over the next several years,” said Peter Kukielski, Hudbay’s President and Chief Executive Officer. “Our project execution, operational optimization and exploration efforts over the past year have been successful in setting up the business for this next phase of growth, which sees Constancia’s annual copper production above 100,000 tonnes for the next eight years and Snow Lake’s annual gold production over 180,000 ounces once New Britannia is fully operational. We also continue to maintain our low-cost profile as demonstrated by the cash costs in our updated mine plans. Hudbay has a proven track record of delivering value through exploration, mine development and successful operations, and we look forward to continuing to create value through leveraging our core competencies.”
Constancia Mine
The company has released an updated mine plan for its Constancia operations that reflects an increase in copper and gold production from 2022 to 2025 as the higher grades from the Pampacancha deposit enter the mine plan. The updated mine plan incorporates higher-grade reserves including the Constancia North pit extension (please refer to Figure 1 for a view of the extended Constancia pit). With the incorporation of Pampacancha and Constancia North, annual production at Constancia is expected to average approximately 102,000 tonnes of copper and 58,000 ounces of gold over the next eight years, an increase of 40% and 367%, respectively, from 2020 levels, which were partially impacted by an eight-week temporary mine interruption related to a government-declared state of emergency. Constancia’s total copper and gold production increases by 12% and 9%, respectively, compared to the same period in the company’s previous NI 43-101 technical report dated March 26, 2018iii.
Constancia maintains its low-cost profile with average cash cost and sustaining cash cost of $1.18 and $1.71, respectively, per pound of copper produced, net of by-product credits, over the next eight years. The total sustaining capital reflects the additional tonnes incorporated into the mine plan, modifications to mine sequence, optimizing material rehandling activities, updated cost environment and further capital investments in the tailings facility to continue to maintain high industry tailings standards. Growth project capital includes remaining Pampacancha development expenditures in 2021 (excluding any remaining land-user agreement costs), the capital costs associated with the implementation of a recovery optimization program scheduled for 2023, the installation of a pebble crusher expected to be in operation by 2024, and the development of a water reservoir in 2025 as part of the company’s water management efforts.
Limited pre-development activities continue on site at Pampacancha to ensure pre-stripping activities can begin immediately after an agreement with the remaining land user family is completed. Hudbay has made significant progress with the remaining land user family and expects to reach an agreement in the coming weeks. First production from Pampacancha continues to be expected in the second quarter of 2021.
In March 2021, Constancia received a upgraded score of “AA” across all the tailings management indicators in the Mining Association of Canada’s Towards Sustainable Mining (“TSM”) program as per an annual self-assessment completed in 2020. This rating was higher than Constancia’s “A” rating in 2019 and exceeded the company’s target of maintaining a minimum of an “A” rating on all five TSM tailings indicators.
Summary of Constancia Updated Mine Plan
A summary of key production and cost details from the updated Constancia mine plan can be found below. For further details, please refer to the section titled “Constancia Updated Mine Plan Detailed Information” at the end of this news release.
| Constancia Operations | 2021 | 2022 | 2023 | 2024 | 2025 | 2026 | 2027 | 2028 | 2021-2028 Avg. | 2029-2037 Avg. | LOM | |
| Contained Metal in Concentrate | ||||||||||||
| Cu Production | tonnes (000s) |
80 | 108 | 117 | 128 | 91 | 95 | 91 | 106 | 102 | 68 | 1,431 |
| Au Production | ounces (000s) |
45 | 97 | 93 | 127 | 28 | 25 | 21 | 27 | 58 | 19 | 631 |
| Ag Production | ounces (000s) |
1,977 | 1,942 | 2,619 | 2,782 | 2,210 | 2,452 | 2,122 | 2,601 | 2,338 | 1,717 | 34,160 |
| Mo Production | tonnes (000s) |
1.3 | 1.4 | 2.5 | 1.6 | 1.9 | 1.3 | 1.6 | 1.6 | 1.6 | 1.0 | 22.1 |
| Capital Expenditures | ||||||||||||
| Sustaining Capital1 | $ millions | $127 | $66 | $158 | $81 | $114 | $66 | $125 | $66 | $100 | $50 | $1,248 |
| Growth Project Capital | $ millions | $4 | - | $30 | - | $17 | - | - | - | - | - | $51 |
| Copper Cash Costs | ||||||||||||
| Cash Cost, net of by-product credits2 | $/lb Cu | $1.37 | $0.97 | $0.80 | $0.74 | $1.48 | $1.47 | $1.37 | $1.27 | $1.18 | $1.71 | $1.38 |
| Sustaining Cash Cost, net of by-product credits2 | $/lb Cu | $2.30 | $1.39 | $1.44 | $1.05 | $2.08 | $1.82 | $2.03 | $1.58 | $1.71 | $2.09 | $1.83 |
Note: Totals may not add up correctly due to rounding. “LOM” refers to life-of-mine total.
1 After the impact of capitalized stripping.
2 By-product credits calculated using the gold and silver deferred revenue drawdown rates for 2021 and the following commodity prices: gold price of $1,800 per ounce for 2021, $1,700 per ounce for 2022, $1,650 per ounce for 2023, $1,600 per ounce for 2024 and $1,500 per ounce long-term; silver prices of $25 per ounce for 2021, $23 per ounce for 2022, $20 per ounce for 2023, $19 per ounce for 2024 and $18 per ounce long-term; molybdenum prices of $11 per pound for 2021 and $10 per pound for 2022 and long-term. Sustaining cash cost calculated on the same basis as used in the company’s quarterly financial disclosures, which incorporates all costs included in cash cost plus sustaining capital expenditures, payments on capital leases, capitalized exploration, royalties, cash payments on long-term community agreements, and accretion and amortization of decommissioning obligations. Cash cost and sustaining cash cost are non-IFRS financial performance measures with no standardized definition under IFRS. For further details on why Hudbay believes cash costs are a useful performance indicator, please refer to the company's most recent Management's Discussion and Analysis for the three and twelve months ended December 31, 2020.
Constancia Mineral Reserves and Resources
Proven and probable reserves at Constancia increased by 33 million tonnes at a grade of 0.48% copper and 0.115 grams per tonne gold, resulting in an increase of approximately 11% in contained copper and 12% in contained gold over the prior year’s reserves, after adjusting for mining depletion in 2020. This more than replaces what was depleted from mining operations during the year, resulting in the addition of one year to Constancia’s mine life, which has been maintained at 17 years. The increase in reserves was primarily as a result of the 2019 and 2020 drill program at Constancia North, which intersected shallow porphyry and skarn mineralization and contributed to an extension of the Constancia reserve pit by approximately 300 metres to the north. The increase in gold content was also partly due to the correction of a low bias in the historical drillhole database at Constancia.
Constancia North also contributed to an improvement in the head grade of the Constancia mine mineral resource estimates: measured and indicated copper grades increased to 0.22% from 0.19% and inferred copper grades increased to 0.30% from 0.18%. A significant portion of the Constancia North resource estimate is classified as inferred due to wide drill spacing but there remains the opportunity to upgrade these inferred resources to a higher classification as the company completes infill drilling. There also remains further opportunity to extend the Constancia North resources by incorporating steeply dipping high-grade skarn mineralization through a potential underground operation and a scoping study is expected to be completed in 2021. The mineralization remains open down plunge to the north.
Current mineral reserves and resources (exclusive of reserves) for Constancia as of January 1, 2021 are summarized below.
|
Constancia Mine Mineral Reserve and Resource Estimates1,2,3,4,5 |
Tonnes | Cu Grade (%) | Mo Grade (g/t) | Au Grade (g/t) | Ag Grade (g/t) | |
| Constancia Reserves | ||||||
| Proven | 436,500,000 | 0.29 | 83 | 0.041 | 2.88 | |
| Probable | 56,100,000 | 0.25 | 69 | 0.045 | 3.09 | |
| Total Proven and Probable - Constancia | 492,600,000 | 0.29 | 82 | 0.042 | 2.90 | |
| Pampacancha Reserves | ||||||
| Proven | 32,400,000 | 0.59 | 178 | 0.368 | 4.48 | |
| Probable | 7,500,000 | 0.62 | 173 | 0.325 | 5.75 | |
| Total Proven and Probable - Pampacancha | 39,900,000 | 0.60 | 177 | 0.360 | 4.72 | |
| Total Proven and Probable | 532,500,000 | 0.31 | 89 | 0.066 | 3.04 | |
| Constancia Resources | ||||||
| Measured | 125,200,000 | 0.22 | 65 | 0.038 | 2.11 | |
| Indicated | 118,300,000 | 0.22 | 65 | 0.037 | 2.05 | |
| Inferred | 46,600,000 | 0.30 | 73 | 0.054 | 2.72 | |
| Pampacancha Resources | ||||||
| Measured | 11,400,000 | 0.41 | 101 | 0.245 | 4.95 | |
| Indicated | 6,000,000 | 0.35 | 84 | 0.285 | 5.16 | |
| Inferred | 10,100,000 | 0.14 | 143 | 0.233 | 3.86 | |
| Total Measured and Indicated | 260,900,000 | 0.23 | 67 | 0.052 | 2.27 | |
| Total Inferred | 56,700,000 | 0.27 | 86 | 0.086 | 2.92 | |
Note: totals may not add up correctly due to rounding.
1 Mineral resources are exclusive of mineral reserves and do not have demonstrated economic viability.
2 Mineral resources in the above tables do not include mining dilution or recovery factors.
3 Metal prices of $3.10 per pound copper, $11.00 per pound molybdenum, $1,500 per ounce gold, and $18.00 per ounce silver were used to estimate mineral reserves and resources.
4 Mineral reserves and resources are estimated using a minimum net smelter return (“NSR”) cut-off of $6.14 per tonne and assuming metallurgical recoveries (applied by ore type) of 85.8% on average for the life of mine.
5 Mineral resources are based on resource pit designs containing measured, indicated, and inferred mineral resources.
Peru Regional Exploration
The company continues to advance regional exploration programs in Peru. In February 2021, drilling commenced on the Quehuincha North high-grade skarn target located approximately 10 kilometres from Constancia’s processing facilities. Exploration agreement discussions with the community of Uchucarcco on the Maria Reyna and Caballito properties are progressing. Maria Reyna is a prospective copper skarn-porphyry target and Caballito is a past-producing copper oxide mine, both of which are located within 10 kilometers north of Constancia. Hudbay also expects to commence drilling at its Llaguen property in the second quarter of 2021, after receiving all required drill permits in 2020. Llaguen is a copper porphyry target located in northern Peru, near the city of Trujillo and in close proximity to existing infrastructure.
For additional details on the Constancia mine, please refer to the technical report titled “NI 43-101 Technical Report, Constancia Mine, Cuzco, Peru”, effective January 1, 2021, which was filed on March 29, 2021 under Hudbay’s profile on SEDAR at www.sedar.com and will be filed on EDGAR at www.sec.gov.
Lalor Mine and Snow Lake Operations
Snow Lake Gold Strategy History - Phases One and Two
In 2019, Hudbay announced the results from the first phase of its Snow Lake gold strategy, which repositioned Lalor as a gold mine with precious metals contributing a majority of the life-of-mine revenues. The first phase included a 65% increase in Lalor’s gold reserves and was the first mine plan that contemplated the processing of gold and copper-gold ore at the company’s New Britannia mill. Several years of detailed work was completed in advance of the phase one mine plan, including significant drilling and test mining of the Lalor gold and copper-gold zones, and trade-off studies on the various processing solutions for the gold ore. The New Britannia mill was determined to be the optimal processing solution for Lalor gold, as it capitalizes on existing infrastructure and is expected to achieve gold recoveries above 90%, compared to gold recoveries of approximately 53% at the Stall mill at that time. The phase one gold mine plan contemplated Lalor’s annual gold production more than doubling from then current levels to approximately 140,000 ounces over the first five years once the New Britannia mill is refurbished.
In March 2020, the company announced the second phase of its Snow Lake gold strategy, focusing on extensive infill and exploration drilling at Lalor and advancing engineering studies on the regional deposits in Snow Lake. This resulted in a 35% increase in total Snow Lake gold reserves to 2.2 million ounces and extended the mine life of the Snow Lake operations to 2037 through extending the Lalor mine life to 10 years and mining the gold-rich WIM and 3 Zone deposits over the last eight years. Lalor’s life-of-mine gold production increased by 41% and annual gold production was contemplated to be greater than 150,000 ounces over the first eight years after the New Britannia mill is refurbished.
Advancing Phase Three of the Snow Lake Gold Strategy
Over the past twelve months, Hudbay has advanced the third phase of its Snow Lake gold strategy focusing on expansion and further optimization of operations. This updated mine plan contemplates an increase in annual gold production from Lalor and the Snow Lake operations to over 180,000 ounces during the first six years of New Britannia’s operation at industry-low cash cost and sustaining cash cost, net of by-product credits, of $412 and $788 per ounce of gold, respectively. Mineral reserves increased year-over-year, which resulted in no change to Snow Lake’s mine life (to 2037) as the company accelerated future reserves with a higher production rate at Lalor and Stall. This enhanced mine plan incorporates the results from several optimization initiatives, including:
-
Early gold production at New Britannia - In 2020, Hudbay identified the opportunity to install modular copper flotation cells to achieve gold production earlier than expected in 2021. As a result, ramp-up and first production at the gold plant is now expected early in the third quarter of 2021, ahead of the original schedule.
-
Increased Lalor Mining Rate to 5,300 tonnes per day - In the fourth quarter of 2020, Hudbay allocated additional mining resources from 777 to Lalor while the 777 shaft repairs were being completed. As a result, and in combination with other technical and operational improvements, Lalor’s mine output increased by an average of 650 tonnes per day above the normal level during this period. After confirming the additional mining capacity, Hudbay determined that an optimal production rate for Lalor is 5,300 tonnes per day, matching the milling capacity of Snow Lake once New Britannia is commissioned. This higher rate is expected to begin after the 777 mine closes in mid-2022 and compares to 4,500 tonnes per day in the previous mine plan.
-
Adding 1901 Deposit to the Mine Plan - After releasing an upgraded resource estimate for the 1901 deposit in August 2020, Hudbay initiated engineering activities to support a prefeasibility study. As part of this study, the company developed a viable mine plan for the zinc-rich zones at the 1901 deposit to supplement production from Lalor and take advantage of the future processing capacity at the Stall mill. This resulted in the addition of 1.58 million tonnes of reserves at a grade of 7.9% zinc. Production from the 1901 deposit is expected to commence in 2026 at a rate of approximately 1,000 tonnes per day. Please refer to Figure 2 for a view of the mine design layout at 1901.
-
Higher Throughput at Stall - Hudbay has been pleased with the recent performance of the Stall mill, which has achieved better than expected throughput rates. The updated mine plan assumes Stall will achieve a throughput rate of 3,800 tonnes per day, compared to 3,500 tonnes per day in the previous mine plan.
-
Increased Copper and Precious Metal Recoveries at Stall - In 2020, Hudbay completed a feasibility study and a test program exploring various technological upgrades to the flowsheet at the Stall mill. The total cost to implement these upgrades is $19 million (C$24 million) and is expected to increase Stall’s copper recoveries to between 91% and 95%, gold recoveries to between 64% and 70%, and silver recoveries to between 65% and 74%, a significant increase from the assumed recoveries in the previous mine plan of 84% copper, 53% gold and 53% silver. The project is expected to commence in 2022 and be in operation by early 2023.
These mine plan enhancements optimize the processing capacity of the Snow Lake operations in a manner that maximizes the net present value of the operations. As a result of these initiatives, the production of gold, copper and silver are expected to increase by 18%, 35% and 27%, respectively, from 2022 to 2027 compared to the previous mine plan.
Summary of Snow Lake Updated Mine Plan
A summary of key production and cost details from the updated Snow Lake mine plan can be found below. For further details, please refer to the section titled “Snow Lake Updated Mine Plan Detailed Information” at the end of this news release.
| Snow Lake Operations1 | 2021 | 2022 | 2023 | 2024 | 2025 | 2026 | 2027 | 2022-2027 Avg. | 2028-2037 Avg. | LOM | |
| Contained Metal in Concentrate and Doré | |||||||||||
| Au Production | ounces (000s) | 115 | 160 | 190 | 191 | 208 | 184 | 162 | 182 | 54 | 1,753 |
| Ag Production | ounces (000s) | 824 | 946 | 1,134 | 1,150 | 1,188 | 1,182 | 1,298 | 1,150 | 340 | 11,120 |
| Cu Production | tonnes (000s) | 10 | 11 | 13 | 11 | 16 | 11 | 12 | 12 | 6 | 142 |
| Zn Production | tonnes (000s) | 61 | 51 | 46 | 46 | 35 | 46 | 57 | 47 | 20 | 541 |
| Capital Expenditures2 | |||||||||||
| Sustaining Capital | $ millions | $83 | $96 | $67 | $62 | $62 | $66 | $48 | $67 | $18 | $664 |
| Growth Project Capital | $ millions | $77 | $19 | - | - | - | - | - | - | - | $96 |
| Gold Cash Costs | |||||||||||
| Cash Cost, net of by-product credits3 | $/oz Au | ($275) | $361 | $434 | $440 | $393 | $454 | $382 | $411 | $647 | $421 |
| Sustaining Cash Cost, net of by-product credits3 | $/oz Au | $550 | $1,027 | $784 | $766 | $690 | $812 | $680 | $793 | $972 | $812 |
Note: Totals may not add up correctly due to rounding. “LOM” refers to life-of-mine total.
1 Includes production and costs for Lalor, 1901, WIM and 3 Zone.
2 Canadian dollar capital expenditures converted to U.S. dollar capital expenditures at a C$/US$ exchange rate of 1.27 in 2021, 1.28 in 2022, 1.29 in 2023 and 1.30 long-term.
3 By-product credits calculated using the following assumptions: zinc price of $1.20 per pound in 2021, $1.15 per pound in 2022, $1.10 per pound in 2023 and long-term; copper price of $3.75 per pound in 2021, $3.30 per pound in 2022, $3.10 per pound in 2023 and long-term; silver price of $25.00 per ounce in 2021, $23.00 per ounce in 2022, $20.00 per pounce in 2023, $19.00 per ounce in 2024, and $18.00 per ounce long-term; C$/US$ exchange rate of 1.27 in 2021, 1.28 in 2022, 1.29 in 2023 and 1.30 for long-term. Sustaining cash cost incorporate all costs included in cash costs calculation plus sustaining capital expenditures. Cash cost and sustaining cash cost are non-IFRS financial performance measures with no standardized definition under IFRS. For further details on why Hudbay believes cash costs are a useful performance indicator, please refer to the company's most recent Management's Discussion and Analysis for the year ended December 31, 2020.
Snow Lake Mineral Reserves and Resources
Current mineral reserves and resources (exclusive of reserves) for Lalor, 1901 and other Snow Lake satellite deposits as of January 1, 2021 are summarized below.
|
Lalor Mine and 1901 Deposit Mineral Reserve and Resource Estimates1,2,3,4,5,6 |
Tonnes | Zn Grade (%) | Au Grade (g/t) | Cu Grade (%) | Ag Grade (g/t) | |
| Base Metal Zone Reserves | ||||||
| Proven – Lalor | 6,860,000 | 5.79 | 2.6 | 0.50 | 29 | |
| Proven – 1901 | 890,000 | 6.61 | 2.0 | 0.40 | 28 | |
| Probable – Lalor | 1,190,000 | 4.32 | 3.2 | 0.64 | 32 | |
| Probable – 1901 | 690,000 | 9.49 | 1.4 | 0.25 | 30 | |
| Gold Zone Reserves | ||||||
| Proven – Lalor | 3,950,000 | 1.03 | 5.2 | 0.60 | 28 | |
| Probable – Lalor | 3,630,000 | 0.53 | 5.7 | 1.16 | 28 | |
| Total Proven and Probable | 17,200,000 | 3.68 | 3.8 | 0.66 | 29 | |
| Base Metal Zone Resources | ||||||
| Inferred – Lalor | 590,000 | 3.48 | 2.8 | 0.31 | 55 | |
| Inferred – 1901 | 310,000 | 6.44 | 2.0 | 0.85 | 25 | |
| Gold Zone Resources | ||||||
| Inferred – Lalor | 5,610,000 | 0.35 | 4.6 | 1.17 | 26 | |
| Inferred – 1901 | 480,000 | 0.55 | 6.7 | 0.72 | 37 | |
| Total Inferred | 6,990,000 | 0.89 | 4.5 | 1.05 | 29 | |
Note: totals may not add up correctly due to rounding.
1 Mineral resources are exclusive of mineral reserves and do not have demonstrated economic viability. Mineral resources in the above tables do not include mining dilution or recovery factors.
2 Mineral reserves and resources are estimated using a minimum NSR cut-off of C$105 per tonne for waste filled mining areas and a minimum of C$116 per tonne for paste filled mining areas.
3 Metal prices of $1.10 per pound zinc, $1,500 per ounce gold, $3.10 per pound copper, and $18.00 per ounce silver with an exchange rate of 1.30 C$/US$ were used to confirm the economic viability of the mineral reserve estimates.
4 For Lalor, individual stope gold grades were capped at 10 grams per tonne as a prudent estimate until reserves to mill reconciliations can establish that the high-grade gold can indeed be entirely recovered. This capping method resulted in the reduction of the global gold reserve grade by approximately 3%.
5 Base metal mineral resources are estimated based on the assumptions that they would be processed at the Stall concentrator while gold mineral resources are estimated based on the assumption that they would be processed at the New Britannia concentrator, which is currently being refurbished.
6 1901 mineral resources were initially estimated using metal price assumptions that vary marginally from the assumptions used for reserves. In the Qualified Person’s opinion, the combined impact of these small variations does not have any impact on the mineral resource estimates.
|
Snow Lake Regional Deposits - Gold Mineral Reserve and Resource Estimates1,2,3,4,5,6,7 |
Tonnes | Zn Grade (%) | Au Grade (g/t) | Cu Grade (%) | Ag Grade (g/t) | |
| Probable Reserves | ||||||
| WIM | 2,450,000 | 0.25 | 1.6 | 1.63 | 6.3 | |
| 3 Zone | 660,000 | - | 4.2 | - | - | |
| Total Probable (Gold) | 3,110,000 | 0.20 | 2.2 | 1.28 | 5.0 | |
| Inferred Resources | ||||||
| Birch | 570,000 | - | 4.4 | - | - | |
| New Britannia | 2,750,000 | - | 4.5 | - | - | |
| Total Inferred (Gold) | 3,320,000 | - | 4.5 | - | - | |
Note: totals may not add up correctly due to rounding.
1 Mineral resources are exclusive of mineral reserves and do not have demonstrated economic viability.
2 Mineral resources in the above tables do not include mining dilution or recovery factors.
3 Metal prices of $1.10 per pound zinc, $1,500 per ounce gold, $3.10 per pound copper, and $18.00 per ounce silver with an exchange rate of 1.30 C$/US$ were used to confirm the economic viability of the mineral reserve estimates.
4 WIM mineral reserves are estimated using a minimum NSR cut-off of C$150 per tonne, assuming processing recoveries of 98% for copper, 88% for gold and 70% for silver based on processing through New Britannia mill's flotation and tails leach circuits.
5 3 Zone mineral reserves are estimated at a minimum NSR cut-off of C$150 per tonne, assuming processing recoveries of 85% for gold based on processing through New Britannia mill's leach circuit.
6 New Britannia mineral resource estimates have been reported at a minimum true width of 1.5 metres and with a cut-off grade varying from 2 grams per tonne (at the lower part of New Britannia) to 3.5 grams per tonne (at the upper part of New Britannia).
7 Gold mineral resources are estimated based on the assumption that they would be processed at the New Britannia concentrator, which is currently being refurbished.
|
Snow Lake Regional Deposits – Base Metal Mineral Reserve and Resource Estimates1,2,3,4,5,6,7 |
Tonnes | Zn Grade (%) | Au Grade (g/t) | Cu Grade (%) | Ag Grade (g/t) | |
| Indicated Resources | ||||||
| Pen II | 470,000 | 8.89 | 0.3 | 0.49 | 7 | |
| Talbot | 2,190,000 | 1.79 | 2.1 | 2.33 | 36 | |
| Total Indicated (Base Metals) | 2,660,000 | 3.04 | 1.8 | 2.01 | 31 | |
| Inferred Resources | ||||||
| Watts | 3,150,000 | 2.58 | 1.0 | 2.34 | 31 | |
| Pen II | 130,000 | 9.81 | 0.3 | 0.37 | 7 | |
| Talbot | 2,450,000 | 1.74 | 1.9 | 1.13 | 26 | |
| Total Inferred (Base Metals) | 5,730,000 | 2.39 | 1.3 | 1.78 | 28 | |
Note: totals may not add up correctly due to rounding.
1 Mineral resources are exclusive of mineral reserves and do not have demonstrated economic viability.
2 Mineral resources in the above tables do not include mining dilution or recovery factors.
3 Watts and Pen II mineral resources were initially estimated using metal price assumptions that vary marginally over the assumptions used for mineral reserves at Snow Lake. In the Qualified Person’s opinion, the combined impact of these small variations does not have any impact on the mineral resource estimates.
4 Watts mineral resources are estimated using a minimum NSR cut-off of C$150 per tonne, assuming processing recoveries of 90% for copper, 80% for zinc, 70% for gold and 70% for silver.
5 Pen II mineral resources are estimated using a minimum NSR cut-off of C$75 per tonne.
6 Base metal mineral resources are estimated based on the assumption that they would be processed at the Stall concentrator.
7 The above resource estimate table includes 100% of the Talbot mineral resources reported by Rockcliff Metals Corp. in its 2020 NI 43-101 technical report published on SEDAR. Hudbay currently owns 51% interest in the project.
Future Snow Lake Upside Opportunities
Lalor In-Mine Exploration
Exploration efforts at the Lalor mine continued to be successful in 2020 with the definition of an additional 1.8 million tonnes of mineral resources. This increases total inferred mineral resources at Lalor to 6.2 million tonnes. The inferred resources have the potential to extend the Lalor mine life beyond the current estimate of ten years and maintain the 5,300 tonnes per day production level beyond 2027. The increase in Lalor’s mineral resource estimate was due to up-dip and down-dip extensions along strike from existing lenses as well as the inclusion of gold mineralization located in the immediate footwall and hanging wall of the base metal lenses where recent drilling and economic evaluation increased the confidence to include them in the Lalor inferred mineral resources.
Snow Lake Regional Deposits
There are several deposits in the Snow Lake region that present additional opportunities to further optimize the Snow Lake operations, including the Watts, Pen II and Talbot deposits as described below:
- Watts (100% owned by Hudbay) - confirmatory drilling conducted during 2019 supported an initial inferred mineral resource estimate of approximately 3.2 million tonnes at 2.34% copper, 2.58% zinc, 0.95 grams per tonne gold and 31 grams per tonne silver. The Watts deposit is located approximately 95 kilometres from the Stall concentrator and is in close proximity to roads and power lines. Considering future available processing capacity at the Stall concentrator and recent drilling success, which expanded the volume of high-grade copper mineralization at Watts, Hudbay is confident that the potential for economic extraction of the Watts deposit has been established to a level sufficient to report an initial inferred mineral resource estimate.
- Pen II (100% owned by Hudbay) - Pen II is a low tonnage and high-grade zinc deposit that starts from surface and is located within trucking distance of the Stall mill. In 2019, Hudbay defined an indicated resource estimate of 0.5 million tonnes at 8.9% zinc. Pen II could constitute a supplemental source of feed for the Stall mill. Hudbay expects to continue metallurgical testing, infill drilling and technical studies in an attempt to confirm the technical and economic viability of the resource.
-
Talbot (51% owned by Hudbay) - the Talbot deposit is located approximately 200 kilometres southeast of the Stall and New Britannia mills. Rockcliff Metals Corp. conducted several drilling campaigns between 2014 and 2019 that led to the declaration by Rockcliff of a NI 43-101 indicated mineral resource estimate of 2.2 million tonnes at 2.3% copper, 2.1 grams per tonne gold, 1.8% zinc, 36 grams per tonne silver and an inferred mineral resource estimate of 2.4 million tonnes at 1.1% copper, 1.9 grams per tonne gold, 1.7% zinc and 25.8 g/t silver. Hudbay has the right to extend its ownership of Talbot to 65% by incurring expenses related to the development of the project.
1901 Deposit Gold Zones
There remains further upside potential to upgrade the inferred resources in 1901 gold zones and incorporate them into the Snow Lake mine plan once there is processing capacity at the New Britannia mill. Once the 1901 deposit is developed, the company will have the underground access required to efficiently drill the gold zones with the tighter drill spacing required to upgrade the inferred resource estimate to the indicated category.
Future Mill Processing Projects
As the Lalor mine matures and additional satellite ore sources are identified to supplement feed to the Stall and New Britannia mills, metallurgical projects are advancing to match the configuration of the mills to the requirements of the ore. The company is advancing several other projects through metallurgical testing and early-stage engineering, such as the potential to treat the tails from the Stall mill to recover additional gold and the potential to expand the New Britannia mill to its historical rate of 2,000 tonnes per day.
For additional details on the Lalor mine and the company’s Snow Lake operations, please refer to the technical report titled “NI 43-101 Technical Report, Lalor and Snow Lake Operations, Manitoba, Canada”, effective January 1, 2021, which was filed on March 29, 2021 under Hudbay’s profile on SEDAR at www.sedar.com and will be filed on EDGAR at www.sec.gov.
777 Mine
Based on the most recent estimate of mineral reserves, there has been no change to the expected mine life for 777, which is expected to be depleted by the end of the second quarter of 2022. The mine is expected to produce at a rate of approximately 2,800 tonnes per day for the remaining mine life. Hudbay has begun its transition planning ahead of the 777 mine closure, including preparation for the training and transfer of personnel from Flin Flon to Snow Lake. The company plans to close and decommission the 777 mine and zinc plant upon the depletion of 777 reserves. The Flin Flon concentrator and tailings impoundment area will be kept on care and maintenance, which will provide optionality should another mineral discovery occur in the Flin Flon area.
Current mineral reserves and resources (exclusive of reserves) for 777 as of January 1, 2021 are summarized below.
|
777 Mine Mineral Reserve and Resource Estimates1 |
Tonnes | Cu Grade (%) | Zn Grade (%) | Au Grade (g/t) | Ag Grade (g/t) | |
| Mineral Reserves | ||||||
| Proven | 1,125,000 | 1.59 | 5.09 | 2.23 | 31 | |
| Probable | 399,000 | 1.11 | 4.46 | 1.86 | 30 | |
| Total Proven and Probable | 1,524,000 | 1.46 | 4.93 | 2.13 | 31 | |
| Mineral Resources | ||||||
| Measured | 120,000 | 1.21 | 7.12 | 2.31 | 39 | |
| Indicated | 90,000 | 1.77 | 4.83 | 1.61 | 31 | |
| Total Measured and Indicated | 210,000 | 1.45 | 6.13 | 2.01 | 35 | |
| Inferred | - | - | - | - | - | |
Note: totals may not add up correctly due to rounding.
1 Mineral resources are exclusive of mineral reserves and do not have demonstrated economic viability. Mineral reserves and resources calculated using life-of-mine (2021-2022) average metal prices of $2.90 per pound copper, $1.04 per pound zinc (includes premium), $1,767 per ounce gold, $20.67 per ounce silver and using a C$/US$ exchange rate of 1.30.
3-Year Production Outlook
Consolidated copper and gold production are expected to increase by 36% and 125%, respectively, by 2023 from 2020 levels as Hudbay brings online its Pampacancha and New Britannia growth projects. These growth projects more than offset the lost copper and gold production from 777 after its closure in mid-2022.
Peru’s 2021 production guidance assumes mining of Pampacancha will begin in the second quarter, with the initial phase of lower copper grades, but higher gold grades, expected to continue for the balance of the year before higher copper grades are forecast to enter the mine plan in 2022 and 2023.
Manitoba’s 2021 production guidance reflects an increase in Lalor’s mine throughput to 4,650 tonnes per day, from the previous 4,500 tonnes per day, as the recent trend of stronger production from the mine is expected to continue. Lalor’s mine throughput is expected to further increase to 5,300 tonnes per day starting in 2023 due to technical and operational improvements and the allocation of mining resources from the 777 mine after its closure in 2022. Manitoba’s 2023 production reflects higher copper, gold and silver recoveries at the Stall mill as a result of the implementation of various mill flowsheet enhancements in 2022.
|
3-Year Production Outlook Contained Metal in Concentrate1 |
2021 Guidance | 2022 Guidance | 2023 Guidance | ||
| Peru | |||||
| Copper | tonnes | 72,000 - 88,000 | 95,000 - 120,000 | 105,000 - 130,000 | |
| Gold | ounces | 40,000 - 50,000 | 85,000 - 105,000 | 85,000 - 105,000 | |
| Silver | ounces | 1,800,000 - 2,170,000 | 1,700,000 - 2,100,000 | 2,300,000 - 2,800,000 | |
| Molybdenum | tonnes | 1,400 - 1,700 | 1,200 - 1,500 | 2,200 - 2,800 | |
| Manitoba2 | |||||
| Gold | ounces | 150,000 - 165,000 | 160,000 - 180,000 | 175,000 - 195,000 | |
| Zinc | tonnes | 96,000 - 107,000 | 60,000 - 70,000 | 40,000 - 47,000 | |
| Copper | tonnes | 20,000 - 24,000 | 14,000 - 16,000 | 11,000 - 13,000 | |
| Silver | ounces | 1,200,000 - 1,400,000 | 1,000,000 - 1,200,000 | 1,000,000 - 1,200,000 | |
| Total | |||||
| Copper | tonnes | 92,000 - 112,000 | 109,000 - 136,000 | 116,000 - 143,000 | |
| Gold | ounces | 190,000 - 215,000 | 245,000 - 285,000 | 260,000 - 300,000 | |
| Zinc | tonnes | 96,000 - 107,000 | 60,000 - 70,000 | 40,000 - 47,000 | |
| Silver | ounces | 3,000,000 - 3,570,000 | 2,700,000 - 3,300,000 | 3,300,000 - 4,000,000 | |
| Molybdenum | tonnes | 1,400 - 1,700 | 1,200 - 1,500 | 2,200 - 2,800 | |
|
1 Metal reported in concentrate and doré is prior to smelting and refining losses or deductions associated with smelter terms. 2 Manitoba production guidance assumes the 777 mine is depleted at the end of the second quarter of 2022, resulting in lower copper and zinc production after its closure. |
|||||
Rosemont Project
Rosemont is a copper development project, located in Pima County, Arizona, approximately 50 kilometres southeast of Tucson. The Rosemont project is expected to be an open pit, shovel and truck operation and has an expected 19-year mine life based on current reserves. There were no changes to Rosemont’s reserves and resources during 2020. The appeal of the unprecedented Rosemont court decision with the U.S. Court of Appeals for the Ninth Circuit continues with a decision expected in the second half of 2021.
On March 24, 2021, the U.S. Army Corps of Engineers (the “Corps”) issued an approved jurisdictional determination whereby the Corps determined that waters of the United States do not occur on the Rosemont property. As a result, Rosemont is no longer subject to the Clean Water Act and does not require a Section 404 Water Permit.
On March 29, 2021, Hudbay announced the intersection of high-grade copper sulphide and oxide mineralization at shallow depth on its Copper World properties located on wholly owned patented mining claims within seven kilometres of Rosemont. The drill program was initiated in 2020 to confirm historical drilling in this past-producing copper region formerly known as Helvetia. After receiving encouraging initial results, the company launched a larger drill program in early 2021 and has since doubled the number of drill rigs at site to six to further test the four known deposits at Copper World and the potential for additional mineralization. For further details, including a full list of assay results and detailed figures illustrating the location of the deposits, please refer to the news release dated March 29, 2021.
Mason Project
The Mason project is a large greenfield copper deposit located in the historic Yerington District of Nevada and is one of the largest undeveloped copper porphyry deposits in North America. Mason’s measured and indicated mineral resources are comparable in size to Constancia and Rosemont. Hudbay views the Mason project as a long-term option for future development and a strong component of its pipeline of long-term growth opportunities. Since acquiring Mason, Hudbay has consolidated a prospective package of patented and unpatented mining claims contiguous to the Mason project and has advanced a number of technical studies.
This updated resource estimate represents the first compiled for the Mason project from a resource model constructed by Hudbay personnel using the same methods applied at Constancia. Based on this new model, including resource classification criteria calibrated on historical performance at Constancia, control of grade over-smoothing in the central zone of the deposit and the use of a lower cut-off grade, the measured and indicated resources have increased to 2.2 billion tonnes at 0.29% copper, from 1.4 billion tonnes at 0.32% copper previously. Hudbay expects to release the results of its preliminary economic assessment of Mason in April 2021 based on this revised resource model and an updated mine plan.
Current mineral resource estimates for Mason based on the revised resource model as of January 1, 2021 are summarized below.
|
Mason Project Mineral Resource Estimates1,2,3 |
Tonnes | Cu Grade (%) | Mo Grade (g/t) | Au Grade (g/t) | Ag Grade (g/t) | |
| Measured | 1,417,000,000 | 0.29 | 59 | 0.031 | 0.66 | |
| Indicated | 801,000,000 | 0.30 | 80 | 0.025 | 0.57 | |
| Total Measured and Indicated | 2,219,000,000 | 0.29 | 67 | 0.029 | 0.63 | |
| Inferred | 237,000,000 | 0.24 | 78 | 0.033 | 0.73 | |
Note: totals may not add up correctly due to rounding.
1 Mineral resource estimates that are not mineral reserves do not have demonstrated economic viability. Mineral resource estimates do not include factors for mining recovery or dilution.
2 Metal prices of $3.10 per pound copper, $11.00 per pound molybdenum, $1,500 per ounce gold, and $18.00 per ounce silver were used to estimate mineral resources.
3 Mineral resource estimates are reported as 20 metres by 20 metres by 15 meters blocks above cut-off using a minimum NSR per tonne of $6.25.
Non-IFRS Financial Performance Measures
Cash cost and sustaining cash cost per pound of copper and ounce of gold produced are shown because the company believes they help investors and management assess the performance of its operations, including the margin generated by the operations and the company. Unit operating costs are shown because these measures are used by the company as a key performance indicator to assess the performance of its mining and processing operations. These measures do not have a meaning prescribed by IFRS and are therefore unlikely to be comparable to similar measures presented by other issuers. These measures should not be considered in isolation or as a substitute for measures prepared in accordance with IFRS and are not necessarily indicative of operating profit or cash flow from operations as determined under IFRS. Other companies may calculate these measures differently. For further details on these measures, including reconciliations of historical unit operating costs and cash costs per pound of copper produced to the most comparable IFRS measures, please refer to page 53 of Hudbay’s management’s discussion and analysis for the three and twelve months ended December 31, 2020 available on SEDAR at www.sedar.com.
Qualified Person
The scientific and technical information contained in this news release related to the Rosemont project has been approved by Cashel Meagher, P.Geo., Hudbay’s Senior Vice President and Chief Operating Officer. The scientific and technical information contained in this news release related to all other material mineral projects has been approved by Olivier Tavchandjian, P. Geo, Hudbay’s Vice-President, Exploration and Geology. Messrs. Meagher and Tavchandjian are qualified persons pursuant to NI 43 101.
Additional details on the company’s material mineral projects, including a year-over-year reconciliation of reserves and resources, is included in Hudbay's Annual Information Form for the year ended December 31, 2020 (the “AIF”), which is available on SEDAR at www.sedar.com.
Note to United States Investors
This news release has been prepared in accordance with the requirements of the securities laws in effect in Canada, which differ from the requirements of United States securities laws. Canadian reporting requirements for disclosure of mineral properties are governed by the Canadian Securities Administrators’ National Instrument 43-101 Standards of Disclosure for Mineral Projects (“NI 43-101”).
For this reason, information contained in this news release containing descriptions of the Company’s mineral deposits may not be comparable to similar information made public by United States companies subject to the reporting and disclosure requirements under the United States federal securities laws and the rules and regulations thereunder. For further information on the differences between the disclosure requirements for mineral properties under the United States federal securities laws and NI 43-101, please refer to the company’s AIF, a copy of which has been filed under Hudbay’s profile on SEDAR at www.sedar.com and the company’s Form 40-F, a copy of which will be filed on EDGAR at www.edgar.com.
Forward-Looking Information
This news release contains forward-looking information within the meaning of applicable Canadian and United States securities legislation. All information contained in this news release, other than statements of current and historical fact, is forward-looking information. Often, but not always, forward-looking information can be identified by the use of words such as “plans”, “expects”, “budget”, “guidance”, “scheduled”, “estimates”, “forecasts”, “strategy”, “target”, “intends”, “objective”, “goal”, “understands”, “anticipates” and “believes” (and variations of these or similar words) and statements that certain actions, events or results “may”, “could”, “would”, “should”, “might” “occur” or “be achieved” or “will be taken” (and variations of these or similar expressions). All of the forward-looking information in this news release is qualified by this cautionary note.
Forward-looking information includes, but is not limited to, production, cost and capital and exploration expenditure guidance and factors that may have an effect on such guidance, anticipated production and costs at the company’s mines and processing facilities based on recently updated mine plans, expectations regarding the timing of mining activities at the Pampacancha deposit and any additional delivery obligations under the Constancia stream agreement, the anticipated timing, cost and benefits of developing the Rosemont project and the outcome of litigation challenging Rosemont's permits, expectations regarding the Helvetia exploration program, expectations regarding the Lalor gold strategy, including the refurbishment, commissioning and ramp-up of the New Britannia mill and the expectations regarding the mine plan for the 1901 deposit, increasing the mining rate at Lalor and optimizing the Stall and New Britannia mills (including the cost of, and anticipated benefits from, the Stall mill recovery improvement project), the possibility of converting inferred mineral resource estimates to higher confidence categories, expectations regarding the preliminary economic assessment of the Mason project, the potential and the company’s anticipated plans for advancing its mining properties surrounding Constancia and elsewhere in Peru, anticipated mine plans, anticipated metals prices and the anticipated sensitivity of the company’s financial performance to metals prices, events that may affect its operations and development projects, anticipated cash flows from operations and related liquidity requirements, the anticipated effect of external factors on revenue, such as commodity prices, estimation of mineral reserves and resources, mine life projections, reclamation costs, economic outlook, government regulation of mining operations, and business and acquisition strategies. Forward-looking information is not, and cannot be, a guarantee of future results or events. Forward-looking information is based on, among other things, opinions, assumptions, estimates and analyses that, while considered reasonable by us at the date the forward-looking information is provided, inherently are subject to significant risks, uncertainties, contingencies and other factors that may cause actual results and events to be materially different from those expressed or implied by the forward-looking information.
The material factors or assumptions that Hudbay identified and were applied by the company in drawing conclusions or making forecasts or projections set out in the forward-looking information include, but are not limited to:
- the company’s ability to continue to operate safely and at full capacity during the COVID-19 pandemic;
- the availability, global supply and effectiveness of COVID-19 vaccines, the effective distribution of such vaccines in the countries in which the company operates, the lessening of restrictions related to COVID-19, and the anticipated rate and timing for each of the foregoing;
- the company’s ability to achieve production and unit cost guidance;
- no significant interruptions to the company’s operations or significant delays to its development projects in Manitoba and Peru due to the COVID-19 pandemic;
- the timing of development and production activities on the Pampacancha deposit;
- the timing for reaching additional agreements with individual community members and no significant unanticipated delays to the development of Pampacancha;
- the successful completion of the New Britannia project on budget and on schedule;
- the successful outcome of the Rosemont litigation;
- the successful renegotiation of collective agreements with the labour unions that represent certain of our employees in Manitoba and Peru;
- the success of mining, processing, exploration and development activities;
- the scheduled maintenance and availability of the company’s processing facilities;
- the accuracy of geological, mining and metallurgical estimates;
- anticipated metals prices and the costs of production;
- the supply and demand for metals Hudbay produces;
- the supply and availability of all forms of energy and fuels at reasonable prices;
- no significant unanticipated operational or technical difficulties;
- the execution of the company’s business and growth strategies, including the success of its strategic investments and initiatives;
- the availability of additional financing, if needed;
- the timing and receipt of various regulatory and governmental approvals (including approval of the updated closure plan for the company’s Flin Flon operations);
- the availability of personnel for the company’s exploration, development and operational projects and ongoing employee relations;
- maintaining good relations with the labour unions that represent certain of the company’s employees in Manitoba and Peru;
- maintaining good relations with the communities in which the company operates, including the neighbouring Indigenous communities and local governments;
- no significant unanticipated challenges with stakeholders at the company’s various projects;
- no significant unanticipated events or changes relating to regulatory, environmental, health and safety matters;
- no contests over title to Hudbay’s properties, including as a result of rights or claimed rights of Indigenous peoples or challenges to the validity of its unpatented mining claims;
- the timing and possible outcome of pending litigation and no significant unanticipated litigation;
- certain tax matters, including, but not limited to current tax laws and regulations and the refund of certain value added taxes from the Canadian and Peruvian governments; and
- no significant and continuing adverse changes in general economic conditions or conditions in the
- financial markets (including commodity prices and foreign exchange rates).
The risks, uncertainties, contingencies and other factors that may cause actual results to differ materially from those expressed or implied by the forward-looking information may include, but are not limited to, risks associated with the COVID-19 pandemic and its effect on the company’s operations, financial condition, projects and prospects, the possibility of a global recession arising from the COVID-19 pandemic and attempts to control it, the political situation in Peru, including risks associated with the upcoming national election, risks generally associated with the mining industry, such as economic factors (including future commodity prices, currency fluctuations, energy prices and general cost escalation), uncertainties related to the development and operation of the company’s projects, risks related to the U.S. district court’s decisions to set aside the U.S. Forest Service’s Final Record of Decision (“FROD”) and the Biological Opinion for Rosemont and related appeals and other legal challenges, risks related to the new Lalor mine plan, including the schedule for the refurbishment and commissioning of the New Britannia mill, risks related to the schedule for mining the Pampacancha deposit (including risks associated with COVID-19, with reaching additional agreements with individual community members and the impact of any schedule delays), dependence on key personnel and employee and union relations, risks related to political or social unrest or change, risks in respect of Indigenous and community relations, rights and title claims, operational risks and hazards, including the cost of maintaining and upgrading the company's tailings management facilities and any unanticipated environmental, industrial and geological events and developments and the inability to insure against all risks, failure of plant, equipment, processes, transportation and other infrastructure to operate as anticipated, compliance with government and environmental regulations, including permitting requirements and anti-bribery legislation, depletion of the company’s reserves, volatile financial markets that may affect Hudbay’s ability to obtain additional financing on acceptable terms, the failure to obtain required approvals or clearances from government authorities on a timely basis, uncertainties related to the geology, continuity, grade and estimates of mineral reserves and resources, and the potential for variations in grade and recovery rates, uncertain costs of reclamation activities, the company’s ability to comply with its pension and other post-retirement obligations, the company’s ability to abide by the covenants in its debt instruments and other material contracts, tax refunds, hedging transactions, as well as the risks discussed under the heading “Risk Factors” in the company’s AIF.
Should one or more risk, uncertainty, contingency or other factor materialize or should any factor or assumption prove incorrect, actual results could vary materially from those expressed or implied in the forward-looking information. Accordingly, you should not place undue reliance on forward-looking information. The company does not assume any obligation to update or revise any forward-looking information after the date of this news release or to explain any material difference between subsequent actual events and any forward-looking information, except as required by applicable law.
About Hudbay
Hudbay (TSX, NYSE: HBM) is a diversified mining company primarily producing copper concentrate (containing copper, gold and silver) and zinc metal. Directly and through its subsidiaries, Hudbay owns three polymetallic mines, four ore concentrators and a zinc production facility in northern Manitoba and Saskatchewan (Canada) and Cusco (Peru), and copper projects in Arizona and Nevada (United States). The company’s growth strategy is focused on the exploration, development, operation and optimization of properties it already controls, as well as other mineral assets it may acquire that fit its strategic criteria. Hudbay’s vision is to be a responsible, top-tier operator of long-life, low-cost mines in the Americas. Hudbay’s mission is to create sustainable value through the acquisition, development and operation of high-quality, long-life deposits with exploration potential in jurisdictions that support responsible mining, and to see the regions and communities in which the company operates benefit from its presence. The company is governed by the Canada Business Corporations Act and its shares are listed under the symbol "HBM" on the Toronto Stock Exchange, New York Stock Exchange and Bolsa de Valores de Lima. Further information about Hudbay can be found on www.hudbay.com.
For investor and media inquiries, please contact:
Candace Brûlé
Director, Investor Relations
(416) 814-4387
candace.brule@hudbay.com
Constancia Updated Mine Plan Detailed Information
Constancia Mine Plan
| 2021 | 2022 | 2023 | 2024 | 2025 | 2026 | 2027 | 2028 | 2021-2028 Avg. | 2029-2037 Avg. | LOM | ||
| Constancia Ore | ||||||||||||
| Ore Milled | tonnes (000s) |
25,283 | 21,784 | 19,241 | 19,920 | 29,915 | 31,350 | 31,350 | 31,437 | 26,285 | 31,369 | 492,606 |
| Cu Grade | % | 0.32% | 0.35% | 0.35% | 0.27% | 0.32% | 0.35% | 0.33% | 0.39% | 0.34% | 0.25% | 0.29% |
| Au Grade | g/t | 0.03 | 0.04 | 0.04 | 0.03 | 0.04 | 0.05 | 0.05 | 0.05 | 0.04 | 0.04 | 0.04 |
| Ag Grade | g/t | 2.90 | 2.98 | 2.95 | 2.68 | 3.26 | 3.71 | 3.24 | 3.88 | 3.26 | 2.62 | 2.89 |
| Mo Grade | % | 0.01% | 0.01% | 0.01% | 0.01% | 0.01% | 0.01% | 0.01% | 0.01% | 0.01% | 0.01% | 0.01% |
| Pampacancha Ore | ||||||||||||
| Ore Milled | tonnes (000s) |
5,661 | 9,174 | 12,109 | 11,517 | 1,435 | - | - | - | 7,9791 | - | 39,896 |
| Cu Grade | % | 0.27% | 0.55% | 0.58% | 0.81% | 0.69% | - | - | - | 0.60% | - | 0.60% |
| Au Grade | g/t | 0.25 | 0.40 | 0.30 | 0.45 | 0.33 | - | - | - | 0.36 | - | 0.36 |
| Ag Grade | g/t | 3.32 | 3.03 | 5.23 | 6.28 | 4.14 | - | - | - | 4.72 | - | 4.72 |
| Mo Grade | % | 0.02% | 0.01% | 0.03% | 0.01% | 0.02% | - | - | - | 0.02% | - | 0.02% |
| Total Ore | ||||||||||||
| Ore Milled | tonnes (000s) |
30,944 | 30,958 | 31,350 | 31,438 | 31,350 | 31,350 | 31,350 | 31,437 | 31,272 | 31,369 | 532,502 |
| Cu Grade | % | 0.31% | 0.41% | 0.44% | 0.47% | 0.34% | 0.35% | 0.33% | 0.39% | 0.38% | 0.25% | 0.31% |
| Au Grade | g/t | 0.07 | 0.15 | 0.14 | 0.19 | 0.05 | 0.05 | 0.05 | 0.05 | 0.09 | 0.04 | 0.07 |
| Ag Grade | g/t | 2.97 | 2.99 | 3.83 | 4.00 | 3.30 | 3.71 | 3.24 | 3.88 | 3.49 | 2.62 | 3.03 |
| Mo Grade | % | 0.01% | 0.01% | 0.02% | 0.01% | 0.01% | 0.01% | 0.01% | 0.01% | 0.01% | 0.01% | 0.01% |
Note: LOM refers to life-of-mine total.
1 Pampacancha average over the 2021 to 2025 period.
Constancia Production Profile
| 2021 | 2022 | 2023 | 2024 | 2025 | 2026 | 2027 | 2028 | 2021-2028 Avg. | 2029-2037 Avg. | LOM | ||
| Recoveries | ||||||||||||
| Cu Recovery | % | 84.8% | 85.1% | 84.7% | 86.9% | 85.7% | 86.9% | 86.4% | 86.4% | 85.9% | 86.0% | 85.9% |
| Au Recovery | % | 61.6% | 65.5% | 66.1% | 67.4% | 52.4% | 47.6% | 45.7% | 49.7% | 57.0% | 46.2% | 56.4% |
| Ag Recovery | % | 66.8% | 65.2% | 67.8% | 68.8% | 66.4% | 65.6% | 64.9% | 66.4% | 66.5% | 65.0% | 65.8% |
| Mo Recovery | % | 33.2% | 44.4% | 45.4% | 45.5% | 47.8% | 46.8% | 50.5% | 48.1% | 45.2% | 47.9% | 46.3% |
| Concentrate | ||||||||||||
| Cu Concentrate | tonnes | 344,590 | 471,501 | 523,575 | 561,679 | 392,638 | 410,620 | 385,224 | 446,422 | 442,031 | 294,179 | 6,183,858 |
| Cu Grade in Conc. | % | 23% | 23% | 22% | 23% | 23% | 23% | 24% | 24% | 23% | 23% | 23% |
| Mo Concentrate | tonnes | 2,583 | 2,794 | 4,977 | 3,285 | 3,748 | 2,621 | 3,237 | 3,120 | 3,296 | 1,989 | 44,262 |
| Mo Grade in Conc. | % | 50% | 50% | 50% | 50% | 50% | 50% | 50% | 50% | 50% | 50% | 50% |
| Contained Metal in Concentrate | ||||||||||||
| Cu Production | tonnes (000s) |
80 | 108 | 117 | 128 | 91 | 95 | 91 | 106 | 102 | 68 | 1,431 |
| Au Production | ounces (000s) |
45 | 97 | 93 | 127 | 28 | 25 | 21 | 27 | 58 | 19 | 631 |
| Ag Production | ounces (000s) |
1,977 | 1,942 | 2,619 | 2,782 | 2,210 | 2,452 | 2,122 | 2,601 | 2,338 | 1,717 | 34,160 |
| Mo Production | tonnes (000s) |
1.3 | 1.4 | 2.5 | 1.6 | 1.9 | 1.3 | 1.6 | 1.6 | 1.6 | 1.0 | 22.1 |
Constancia Capital Expenditures
| 2021 | 2022 | 2023 | 2024 | 2025 | 2026 | 2027 | 2028 | 2021-2028 Avg. | 2029-2037 Avg. | LOM | |||
| Capital Expenditures ($ millions) | |||||||||||||
| Sustaining Capital (before Capitalized Stripping) | $102 | $48 | $118 | $58 | $94 | $50 | $77 | $40 | $73 | $35 | $898 | ||
| Capitalized Stripping | $25 | $18 | $40 | $22 | $20 | $16 | $48 | $26 | $27 | $15 | $350 | ||
| Sustaining Capital (after Capitalized Stripping) | $127 | $66 | $158 | $81 | $114 | $66 | $125 | $66 | $100 | $50 | $1,248 | ||
| Growth Project Capital | $4 | - | $30 | - | $17 | - | - | - | - | - | $51 | ||
| Total Capital Expenditures | $131 | $66 | $187 | $81 | $130 | $66 | $125 | $66 | $106 | $50 | $1,299 | ||
Constancia Unit Operating Costs and Cash Costs
| 2021 | 2022 | 2023 | 2024 | 2025 | 2026 | 2027 | 2028 | 2021-2028 Avg. | 2029-2037 Avg. | LOM | ||
| Unit Operating Costs ($ per tonne milled) | ||||||||||||
| Mining | $3.62 | $3.54 | $3.86 | $3.91 | $4.13 | $4.21 | $4.00 | $3.88 | $3.89 | $2.74 | $3.28 | |
| Milling | $5.39 | $5.33 | $5.31 | $5.37 | $5.29 | $4.81 | $4.85 | $4.84 | $5.15 | $4.80 | $4.96 | |
| G&A | $1.74 | $1.70 | $1.57 | $1.51 | $1.51 | $1.54 | $1.48 | $1.48 | $1.57 | $1.31 | $1.43 | |
| Total Operating Costs (before Capitalized Stripping) | $10.74 | $10.57 | $10.74 | $10.79 | $10.93 | $10.56 | $10.32 | $10.19 | $10.61 | $8.86 | $9.68 | |
| Total Operating Costs (after Capitalized Stripping) | $9.94 | $9.99 | $9.47 | $10.09 | $10.29 | $10.06 | $8.79 | $9.37 | $9.75 | $8.38 | $9.02 | |
| Cash Cost and Sustaining Cash Cost | ||||||||||||
| Cu Production | million pounds | 177 | 237 | 258 | 283 | 201 | 210 | 200 | 233 | 225 | 150 | 3,155 |
| Cash Cost, net of by-product credits | $/lb Cu | $1.37 | $0.97 | $0.80 | $0.74 | $1.48 | $1.47 | $1.37 | $1.27 | $1.18 | $1.71 | $1.38 |
| Sustaining Cash Cost, net of by-product credits | $/lb Cu | $2.30 | $1.39 | $1.44 | $1.05 | $2.08 | $1.82 | $2.03 | $1.58 | $1.71 | $2.09 | $1.83 |
Note:
- Production includes metal contained in concentrate.
- By-product credits calculated using the gold and silver deferred revenue drawdown rates for 2021 and the following commodity prices: gold price of $1,800 per ounce for 2021, $1,700 per ounce for 2022, $1,650 per ounce for 2023, $1,600 per ounce for 2024 and $1,500 per ounce long-term; silver prices of $25 per ounce for 2021, $23 per ounce for 2022, $20 per ounce for 2023, $19 per ounce for 2024 and $18 per ounce long-term; molybdenum prices of $11 per tonne for 2021 and $10 per tonne for 2022 and long-term.
- Sustaining cash cost calculated on the same basis as used in the company’s quarterly financial disclosures, which incorporates all costs included in cash cost plus sustaining capital expenditures, payments on capital leases, capitalized exploration, royalties, cash payments on long-term community agreements, and accretion and amortization of decommissioning obligations.
- Cash cost and sustaining cash cost are non-IFRS financial performance measures with no standardized definition under IFRS. For further details on why Hudbay believes cash costs are a useful performance indicator, please refer to the company's most recent Management's Discussion and Analysis for the three and twelve months ended December 31, 2020.
Snow Lake Updated Mine Plan Detailed Information
Snow Lake Mine Plan
| Stall Mill Feed | 2021 | 2022 | 2023 | 2024 | 2025 | 2026 | 2027 | 2028 | 2029 | 2030 | 2031 | LOM | |
| Lalor Base Metal Ore | |||||||||||||
| Ore Mined | tonnes (000s) |
1,3631 | 1,088 | 1,315 | 1,315 | 1,315 | 1,223 | 935 | 744 | 822 | 487 | 69 | 10,675 |
| Ore Mined | tpd | 3,894 | 3,107 | 3,757 | 3,757 | 3,757 | 3,494 | 2,672 | 2,126 | 2,347 | 1,390 | 197 | - |
| Au Grade | g/t | 3.31 | 2.99 | 3.40 | 3.78 | 4.41 | 3.62 | 3.36 | 2.49 | 2.43 | 2.27 | 3.24 | 3.35 |
| Ag Grade | g/t | 26.41 | 27.55 | 26.39 | 26.71 | 26.98 | 28.59 | 32.75 | 32.96 | 27.32 | 36.15 | 38.06 | 28.48 |
| Cu Grade | % | 0.71% | 0.82% | 0.86% | 0.72% | 1.10% | 0.75% | 0.69% | 0.34% | 0.41% | 0.56% | 0.60% | 0.74% |
| Zn Grade | % | 4.87% | 5.13% | 3.90% | 3.80% | 3.02% | 3.65% | 4.40% | 5.43% | 5.38% | 5.60% | 3.90% | 4.34% |
| 1901 Base Metal Ore | |||||||||||||
| Ore Mined | tonnes (000s) |
- | - | - | - | - | 92 | 334 | 343 | 354 | 312 | 145 | 1,581 |
| Ore Mined | tpd | - | - | - | - | - | 263 | 955 | 981 | 1,011 | 892 | 415 | - |
| Au Grade | g/t | - | - | - | - | - | 2.29 | 2.04 | 1.96 | 1.43 | 1.58 | 1.14 | 1.73 |
| Ag Grade | g/t | - | - | - | - | - | 38.16 | 42.67 | 21.83 | 25.41 | 21.84 | 31.52 | 28.88 |
| Cu Grade | % | - | - | - | - | - | 0.23% | 0.27% | 0.38% | 0.32% | 0.44% | 0.29% | 0.34% |
| Zn Grade | % | - | - | - | - | - | 6.26% | 6.16% | 8.65% | 9.09% | 5.77% | 12.53% | 7.87% |
| Total Ore to Stall | |||||||||||||
| Ore Mined | tonnes (000s) |
1,3631 | 1,088 | 1,315 | 1,315 | 1,315 | 1,315 | 1,270 | 1,088 | 1,175 | 799 | 214 | 12,256 |
| Ore Mined | tpd | 3,894 | 3,107 | 3,757 | 3,757 | 3,757 | 3,757 | 3,627 | 3,107 | 3,358 | 2,282 | 613 | - |
| Au Grade | g/t | 3.31 | 2.99 | 3.40 | 3.78 | 4.41 | 3.52 | 3.01 | 2.32 | 2.13 | 2.00 | 1.82 | 3.14 |
| Ag Grade | g/t | 26.41 | 27.55 | 26.39 | 26.71 | 26.98 | 29.26 | 35.36 | 29.44 | 26.74 | 30.56 | 33.63 | 28.53 |
| Cu Grade | % | 0.71% | 0.82% | 0.86% | 0.72% | 1.10% | 0.71% | 0.58% | 0.35% | 0.38% | 0.51% | 0.39% | 0.68% |
| Zn Grade | % | 4.87% | 5.13% | 3.90% | 3.80% | 3.02% | 3.83% | 4.86% | 6.44% | 6.50% | 5.67% | 9.75% | 4.80% |
Note: Tonnes per day (“tpd”) assumes 350 operating days a year. LOM refers to life-of-mine total. Totals may not add up due to rounding.
1 Includes ore processed at the Flin Flon mill.
| New Britannia Mill Feed | 2021 | 2022 | 2023 | 2024 | 2025 | 2026 | 2027 | 2028 | 2029 | 2030 | 2031 | |
| Lalor Gold Ore | ||||||||||||
| Ore Mined | tonnes (000s) |
214 | 540 | 540 | 540 | 540 | 540 | 540 | 540 | 452 | 387 | 114 |
| Ore Mined | tpd | 611 | 1,543 | 1,543 | 1,543 | 1,543 | 1,543 | 1,543 | 1,543 | 1,292 | 1,106 | 326 |
| Au Grade | g/t | 4.99 | 6.08 | 5.76 | 5.42 | 5.02 | 5.52 | 5.47 | 5.19 | 5.17 | 5.70 | 6.45 |
| Ag Grade | g/t | 26.55 | 26.00 | 25.28 | 27.49 | 27.70 | 25.88 | 29.90 | 36.53 | 41.68 | 27.93 | 31.02 |
| Cu Grade | % | 0.64% | 0.67% | 0.45% | 0.45% | 0.44% | 0.42% | 1.07% | 0.75% | 0.59% | 0.43% | 0.56% |
| Zn Grade | % | 0.22% | 0.68% | 0.88% | 1.06% | 1.22% | 0.84% | 0.93% | 1.02% | 1.06% | 0.63% | 0.95% |
| WIM Gold Ore | ||||||||||||
| Ore Mined | tonnes (000s) |
- | - | - | - | - | - | - | - | - | 104 | 414 |
| Ore Mined | tpd | - | - | - | - | - | - | - | - | - | 298 | 1,182 |
| Au Grade | g/t | - | - | - | - | - | - | - | - | - | 0.76 | 1.24 |
| Ag Grade | g/t | - | - | - | - | - | - | - | - | - | 4.64 | 6.01 |
| Cu Grade | % | - | - | - | - | - | - | - | - | - | 1.22% | 1.62% |
| Zn Grade | % | - | - | - | - | - | - | - | - | - | 0.09% | 0.18% |
| Total Ore to New Britannia | ||||||||||||
| Ore Mined | tonnes (000s) |
214 | 540 | 540 | 540 | 540 | 540 | 540 | 540 | 452 | 492 | 528 |
| Ore Mined | tpd | 611 | 1,543 | 1,543 | 1,543 | 1,543 | 1,543 | 1,543 | 1,543 | 1,292 | 1,404 | 1,507 |
| Au Grade | g/t | 4.99 | 6.08 | 5.76 | 5.42 | 5.02 | 5.52 | 5.47 | 5.19 | 5.17 | 4.65 | 2.36 |
| Ag Grade | g/t | 26.55 | 26.00 | 25.28 | 27.49 | 27.70 | 25.88 | 29.90 | 36.53 | 41.68 | 22.99 | 11.41 |
| Cu Grade | % | 0.64% | 0.67% | 0.45% | 0.45% | 0.44% | 0.42% | 1.07% | 0.75% | 0.59% | 0.60% | 1.39% |
| Zn Grade | % | 0.22% | 0.68% | 0.88% | 1.06% | 1.22% | 0.84% | 0.93% | 1.02% | 1.06% | 0.51% | 0.35% |
| New Britannia Mill Feed (continued) | 2032 | 2033 | 2034 | 2035 | 2036 | 2037 | LOM | |
| Lalor Gold Ore | ||||||||
| Ore Mined | tonnes (000s) |
- | - | - | - | - | - | 4,947 |
| Ore Mined | tpd | - | - | - | - | - | - | - |
| Au Grade | g/t | - | - | - | - | - | - | 5.48 |
| Ag Grade | g/t | - | - | - | - | - | - | 29.55 |
| Cu Grade | % | - | - | - | - | - | - | 0.59% |
| Zn Grade | % | - | - | - | - | - | - | 0.90% |
| WIM Gold Ore | ||||||||
| Ore Mined | tonnes (000s) |
438 | 438 | 401 | 316 | 288 | 49 | 2,448 |
| Ore Mined | tpd | 1,252 | 1,251 | 1,147 | 904 | 822 | 139 | - |
| Au Grade | g/t | 1.55 | 1.74 | 1.82 | 1.82 | 1.68 | 1.87 | 1.60 |
| Ag Grade | g/t | 5.66 | 6.51 | 6.67 | 6.92 | 6.76 | 6.86 | 6.31 |
| Cu Grade | % | 1.47% | 1.72% | 1.71% | 1.71% | 1.67% | 1.70% | 1.63% |
| Zn Grade | % | 0.32% | 0.42% | 0.28% | 0.17% | 0.13% | 0.13% | 0.25% |
| 3 Zone Gold Ore | ||||||||
| Ore Mined | tonnes (000s) |
- | - | 38 | 219 | 219 | 187 | 662 |
| Ore Mined | tpd | - | - | 107 | 625 | 626 | 533 | - |
| Au Grade | g/t | - | - | 3.40 | 4.17 | 4.17 | 4.46 | 4.21 |
| Total Ore to New Britannia | ||||||||
| Ore Mined | tonnes (000s) |
438 | 438 | 439 | 535 | 507 | 235 | 8,057 |
| Ore Mined | tpd | 1,252 | 1,251 | 1,254 | 1,529 | 1,448 | 672 | - |
| Au Grade | g/t | 1.55 | 1.74 | 1.96 | 2.78 | 2.76 | 3.93 | 4.20 |
| Ag Grade | g/t | 5.66 | 6.51 | 6.10 | 4.09 | 3.84 | 1.42 | 20.06 |
| Cu Grade | % | 1.47% | 1.72% | 1.56% | 1.01% | 0.95% | 0.35% | 0.86% |
| Zn Grade | % | 0.32% | 0.42% | 0.26% | 0.10% | 0.07% | 0.03% | 0.63% |
Note: Tonnes per day (“tpd”) assumes 350 operating days a year. LOM refers to life-of-mine total. Totals may not add up due to rounding.
Snow Lake Metallurgical Recoveries
| 2021 | 2022 | 2023 | 2024 | 2025 | 2026 | 2027 | 2028 | 2029 | 2030 | 2031 | 2032 | 2033 | 2034 | 2035 | 2036 | 2037 | LOM | |
| Stall Mill Recoveries | ||||||||||||||||||
| Lalor Base Metal Ore | ||||||||||||||||||
| Cu | 86% | 88% | 93% | 93% | 93% | 93% | 93% | 87% | 89% | 93% | 93% | - | - | - | - | - | - | 91% |
| Au | 59% | 61% | 69% | 66% | 69% | 67% | 65% | 50% | 54% | 60% | 62% | - | - | - | - | - | - | 64% |
| Ag | 60% | 63% | 72% | 70% | 72% | 71% | 69% | 53% | 57% | 64% | 65% | - | - | - | - | - | - | 66% |
| Zn | 92% | 91% | 91% | 91% | 89% | 91% | 91% | 94% | 93% | 92% | 91% | - | - | - | - | - | - | 92% |
| 1901 Base Metal Ore | ||||||||||||||||||
| Cu | - | - | - | - | - | 81% | 84% | 88% | 86% | 90% | 84% | - | - | - | - | - | - | 87% |
| Au | - | - | - | - | - | 42% | 46% | 53% | 49% | 56% | 47% | - | - | - | - | - | - | 50% |
| Ag | - | - | - | - | - | 44% | 48% | 55% | 51% | 58% | 49% | - | - | - | - | - | - | 51% |
| Zn | - | - | - | - | - | 94% | 94% | 94% | 94% | 93% | 97% | - | - | - | - | - | - | 94% |
| New Britannia Recoveries | ||||||||||||||||||
| Lalor Gold Ore | ||||||||||||||||||
| Cu | 93% | 92% | 91% | 91% | 91% | 91% | 93% | 92% | 92% | 91% | 92% | - | - | - | - | - | - | 92% |
| Au | 90% | 91% | 91% | 91% | 90% | 91% | 91% | 91% | 91% | 91% | 91% | - | - | - | - | - | - | 91% |
| Ag | 76% | 76% | 75% | 76% | 76% | 75% | 77% | 78% | 79% | 76% | 76% | - | - | - | - | - | - | 77% |
| WIM Gold Ore | ||||||||||||||||||
| Cu | - | - | - | - | - | - | - | - | - | 97% | 98% | 97% | 98% | 98% | 98% | 98% | 98% | 98% |
| Au | - | - | - | - | - | - | - | - | - | 77% | 84% | 87% | 89% | 89% | 89% | 88% | 90% | 88% |
| Ag | - | - | - | - | - | - | - | - | - | 64% | 70% | 67% | 71% | 71% | 71% | 70% | 71% | 70% |
| 3 Zone Gold Ore | ||||||||||||||||||
| Au | - | - | - | - | - | - | - | - | - | - | - | - | - | 84 % | 85 % | 85 % | 85 % | 85% |
Snow Lake Production Profile
|
Lalor Mine Production |
2021 | 2022 | 2023 | 2024 | 2025 | 2026 | 2027 | 2028 | 2029 | 2030 | 2031 | LOM | |
| Au | ounces (000s) | 115 | 160 | 190 | 191 | 208 | 182 | 152 | 112 | 103 | 86 | 26 | 1,524 |
| Ag | ounces (000s) | 824 | 946 | 1,134 | 1,150 | 1,188 | 1,133 | 1,079 | 912 | 889 | 626 | 142 | 10,022 |
| Cu | tonnes (000s) | 10 | 11 | 13 | 11 | 16 | 11 | 11 | 6 | 5 | 4 | 1 | 99 |
| Zn | tonnes (000s) | 61 | 51 | 46 | 46 | 35 | 41 | 38 | 38 | 41 | 25 | 2 | 424 |
|
1901 Mine Production |
2026 | 2027 | 2028 | 2029 | 2030 | 2031 | LOM | |
| Au | ounces (000s) | 3 | 10 | 11 | 8 | 9 | 3 | 44 |
| Ag | ounces (000s) | 49 | 219 | 134 | 149 | 128 | 72 | 751 |
| Cu | tonnes (000s) | 0 | 1 | 1 | 1 | 1 | 0 | 5 |
| Zn | tonnes (000s) | 5 | 19 | 28 | 30 | 17 | 18 | 117 |
|
WIM Mine Production |
2030 | 2031 | 2032 | 2033 | 2034 | 2035 | 2036 | 2037 | LOM | |
| Au | ounces (000s) | 2 | 14 | 19 | 22 | 21 | 17 | 14 | 3 | 110 |
| Ag | ounces (000s) | 10 | 56 | 54 | 65 | 61 | 50 | 44 | 8 | 347 |
| Cu | tonnes (000s) | 1 | 7 | 6 | 7 | 7 | 5 | 5 | 1 | 39 |
|
3 Zone Mine Production |
2030 | 2031 | 2032 | 2033 | 2034 | 2035 | 2036 | 2037 | LOM | |
| Au | ounces (000s) | - | - | - | - | 3 | 25 | 25 | 23 | 76 |
Note: Production includes metal contained in concentrate and doré. Totals may not add up due to rounding.
Snow Lake Capital Expenditures
| Capital Expenditures | 2021 | 2022 | 2023 | 2024 | 2025 | 2026 | 2027 | 2028 | 2029 | 2030 | |
| Lalor Sustaining Capital | C$ millions | $106 | $123 | $86 | $59 | $48 | $58 | $56 | $47 | $4 | $4 |
| 1901 Sustaining Capital | C$ millions | - | - | - | $22 | $32 | $28 | $7 | $2 | $6 | $2 |
| WIM Sustaining Capital | C$ millions | - | - | - | - | - | - | - | - | $57 | $20 |
| 3 Zone Sustaining Capital | C$ millions | - | - | - | - | - | - | - | - | - | - |
| Total Sustaining Capital | US$ millions | $83 | $96 | $67 | $62 | $62 | $66 | $48 | $38 | $52 | $20 |
| New Britannia Project | C$ millions | $90 | - | - | - | - | - | - | - | - | - |
| Stall Recovery Improvement Project | C$ millions | - | $24 | - | - | - | - | - | - | - | - |
| Snow Lake Camp | C$ millions | $8 | - | - | - | - | - | - | - | - | - |
| Total Growth Capital | US$ millions | $77 | $19 | - | - | - | - | - | - | - | - |
| 2031 | 2032 | 2033 | 2034 | 2035 | 2036 | 2037 | LOM | ||||
| Lalor Sustaining Capital | C$ millions | $1 | - | - | - | - | - | - | $593 | ||
| 1901 Sustaining Capital | C$ millions | - | - | - | - | - | - | - | $98 | ||
| WIM Sustaining Capital | C$ millions | $21 | $15 | $1 | $1 | $1 | $1 | $1 | $118 | ||
| 3 Zone Sustaining Capital | C$ millions | - | - | - | $14 | $22 | $12 | - | $49 | ||
| Total Sustaining Capital | US$ millions | $17 | $11 | $1 | $12 | $18 | $10 | $1 | $664 | ||
| New Britannia Project | C$ millions | - | - | - | - | - | - | - | $90 | ||
| Stall Recovery Improvement Project | C$ millions | - | - | - | - | - | - | - | $24 | ||
| Shared General Plant | C$ millions | - | - | - | - | - | - | - | $8 | ||
| Total Growth Capital | US$ millions | - | - | - | - | - | - | - | $96 | ||
Note: Totals may not add up correctly due to rounding. “LOM” refers to life-of-mine total. Canadian dollar capital expenditures converted to U.S. dollar capital expenditures at a C$/US$ exchange rate of 1.27 in 2021, 1.28 in 2022, 1.29 in 2023 and 1.30 long-term.
Snow Lake Unit Operating Costs and Cash Costs
| 2021 | 2022 | 2023 | 2024 | 2025 | 2026 | 2027 | 2028 | 2029 | 2030 | 2031 | 2032 | 2033 | 2034 | 2035 | 2036 | 2037 | LOM | ||
| Mining Unit Operating Costs (C$/tonne mined) | |||||||||||||||||||
| Lalor | $112 | $102 | $102 | $98 | $102 | $102 | $112 | $114 | $119 | $119 | $138 | - | - | - | - | - | - | $107 | |
| 1901 | - | - | - | - | - | $46 | $87 | $82 | $84 | $91 | $122 | - | - | - | - | - | - | $87 | |
| WIM | - | - | - | - | - | - | - | - | - | $51 | $67 | $68 | $80 | $81 | $81 | $81 | $81 | $75 | |
| 3 Zone | - | - | - | - | - | - | - | - | - | - | - | - | - | $30 | $64 | $74 | $80 | $70 | |
| Milling Unit Operating Costs (C$/tonne milled) | |||||||||||||||||||
| Stall | $26 | $29 | $24 | $23 | $24 | $23 | $24 | $27 | $25 | $36 | $120 | - | - | - | - | - | - | $27 | |
| New Britannia | $45 | $41 | $40 | $40 | $40 | $40 | $41 | $41 | $47 | $44 | $43 | $50 | $51 | $51 | $42 | $44 | $87 | $45 | |
| General & Administrative Unit Costs1 (C$/tonne milled) | |||||||||||||||||||
| Snow Lake | $23 | $26 | $21 | $21 | $21 | $20 | $19 | $19 | $19 | $18 | $13 | $15 | $15 | $15 | $15 | $15 | $15 | $20 | |
1 General and administrative relate to shared service costs for Manitoba allocated to the Snow Lake operations.
| Gold Cash Costs | 2021 | 2022 | 2023 | 2024 | 2025 | 2026 | 2027 | 2028 | 2029 | 2030 | |
| Gold Production | ounces (000s) |
115 | 160 | 190 | 191 | 208 | 184 | 162 | 123 | 111 | 97 |
| Cash Costs | US$/oz | ($275) | $361 | $434 | $440 | $393 | $454 | $382 | $443 | $488 | $627 |
| Sustaining Cash Costs | US$/oz | $550 | $1,027 | $784 | $766 | $690 | $812 | $680 | $749 | $953 | $834 |
| 2031 | 2032 | 2033 | 2034 | 2035 | 2036 | 2037 |
2022-2027 Avg. |
LOM Avg. | |||
| Gold Production | ounces (000s) |
42 | 19 | 22 | 24 | 41 | 39 | 25 | 182 | 103 | |
| Cash Costs | US$/oz | $647 | $669 | $518 | $543 | $642 | $754 | $1,140 | $411 | $421 | |
| Sustaining Cash Costs | US$/oz | $1,056 | $1,271 | $571 | $1,028 | $1,074 | $1,015 | $1,170 | $793 | $812 | |
Note:
- Production includes metal contained in concentrate and doré.
- Cash costs include all onsite (mining, milling and general and administrative) and offsite costs associated with Lalor, 1901, WIM and 3 Zone and are reported net of by-product credits. By-product credits calculated using the following assumptions: zinc price of $1.20 per pound in 2021, $1.15 per pound in 2022, $1.10 per pound in 2023 and long-term; copper price of $3.75 per pound in 2021, $3.30 per pound in 2022, $3.10 per pound in 2023 and long-term; silver price of $25.00 per ounce in 2021, $23.00 per ounce in 2022, $20.00 per pounce in 2023, $19.00 per ounce in 2024, and $18.00 per ounce long-term; C$/US$ exchange rate of 1.27 in 2021, 1.28 in 2022, 1.29 in 2023 and 1.30 for long-term.
- Sustaining cash cost incorporate all costs included in cash costs calculation plus sustaining capital expenditures.
- Cash cost and sustaining cash cost are non-IFRS financial performance measures with no standardized definition under IFRS. For further details on why Hudbay believes cash costs are a useful performance indicator, please refer to the company's most recent Management's Discussion and Analysis for the year ended December 31, 2020.
i Copper and gold production growth based on mid-point of 2023 guidance ranges and 2020 actual production of 95,333 tonnes of copper and 124,622 ounces of gold. 2020 levels were partially impacted by an eight-week temporary mine interruption related to a government-declared state of emergency.
ii Cash cost and sustaining cash cost are non-IFRS financial performance measures with no standardized definition under IFRS. For further details on why Hudbay believes cash costs are a useful performance indicator, please refer to the company's most recent Management's Discussion and Analysis for the three and twelve months ended December 31, 2020.
iii Calculated using 2019 to 2036 production from Hudbay’s previous NI 43-101 technical report for Constancia, dated March 26, 2018, compared to 2021 to 2037 production from the updated mine plan plus 2019 and 2020 actual production to allow for the two mine plans to be comparable based on the timing of Pampacancha.
iv Based on S&P Global’s 2021 cash cost curve. S&P’s costing methodology may be different than the methodology reported by Hudbay or its peers in their public disclosure. For details regarding Hudbay’s actual cash costs, refer to Hudbay’s management’s discussion and analysis for the three and twelve months ended December 31, 2020.
Photos accompanying this announcement are available at
https://www.globenewswire.com/NewsRoom/AttachmentNg/5c102d0b-194c-4f99-8eb0-8ce48265b414
https://www.globenewswire.com/NewsRoom/AttachmentNg/23520566-4135-4090-b7ed-38ab4ff6a6c6
https://www.globenewswire.com/NewsRoom/AttachmentNg/efb975c2-d41a-4203-a3da-4d736086e619
![]()
Figure 1: Constancia Pit Extension
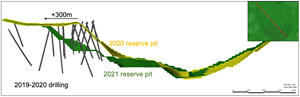
View of Constancia North drill hole locations and 2021 reserve pit extension.
Figure 2: 1901 Mine Design Layout
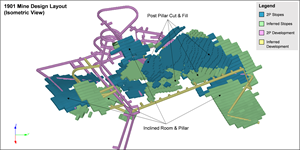
Isometric view of the 1901 mine design layout and mining shapes (only mineral reserve estimates for 1901 have been included in the mine plan for the Snow Lake operations).
Figure 2: 1901 Mine Design Layout
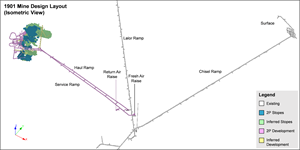
Isometric view of the 1901 mine design layout and mining shapes (only mineral reserve estimates for 1901 have been included in the mine plan for the Snow Lake operations).
